
Public school spending in the United States has experienced a significant surge, with expenditures per student soaring by 8.9% from $14,358 in Fiscal Year (FY) 2021 to $15,633 in FY 2022, as revealed by the latest data from the 2022 Annual Survey of School System Finances released by the U.S. Census Bureau. This remarkable increase marks the most substantial year-to-year rise in public school spending per pupil across all 50 states and the District of Columbia in over two decades. It’s important to note that these statistics are not adjusted for inflation or variations in the cost of living among different geographic regions.
State Disparities in Spending

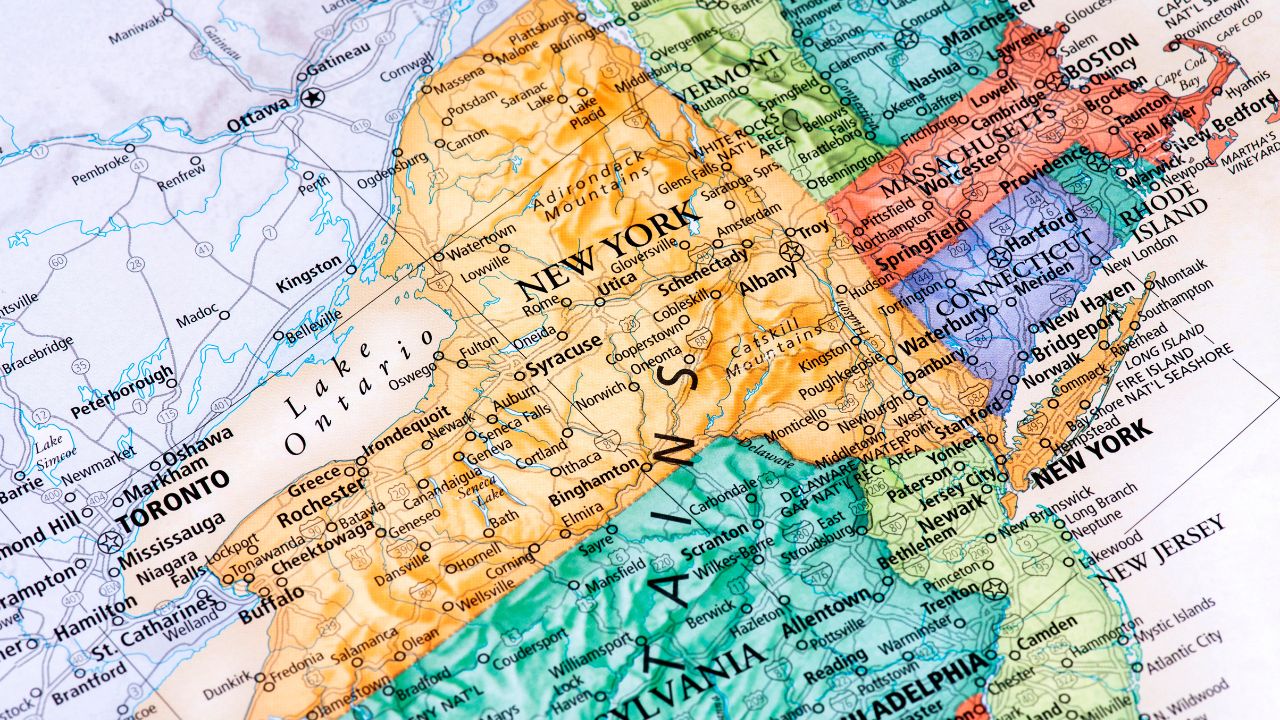
The states with the highest per pupil spending were led by New York, where expenditure reached an impressive $29,873 per student, followed closely by the District of Columbia ($27,425), New Jersey ($25,099), Vermont ($24,608), and Connecticut ($24,453). Conversely, states with the lowest per pupil spending included Utah ($9,552), Idaho ($9,670), Arizona ($10,315), Oklahoma ($10,890), and Mississippi ($10,984).
Regional Trends and School System Rankings
Regional disparities were evident in the distribution of per pupil spending, with seven out of nine Northeastern states ranking among the top 10 in current spending per pupil for FY 2022. Notably, the Northeast region dominated the top rankings, showcasing the commitment to robust educational investments. On the contrary, the majority of states with the lowest per pupil spending were situated in the South or West regions, underscoring regional discrepancies in educational funding priorities.
Analysis of Largest School Systems

Delving deeper into the analysis, among the 100 largest school systems by enrollment, the New York City School District emerged as the top spender, allocating a substantial $35,914 per pupil in FY 2022. Following closely were the Washington Schools in the District of Columbia ($27,425), San Francisco Unified in California ($23,654), Atlanta School District in Georgia ($22,882), Los Angeles Unified in California ($21,940), and Detroit School District in Michigan ($21,771).
Federal Funding and Revenue Sources

Examining the sources of revenue, public school systems in Mississippi, South Dakota, Montana, Alaska, and Arkansas relied heavily on federal sources, with percentages ranging from 20.4% to 23.3% of total revenue in FY 2022. Conversely, states such as New York, New Jersey, Connecticut, New Hampshire, and Massachusetts demonstrated the lowest reliance on federal funding, indicating diverse revenue structures across different states.
Overview of Expenditures and Revenue

Total elementary and secondary education revenue from all sources surged by 8.4% in FY 2022, amounting to a staggering $878.2 billion. Local sources contributed $375.2 billion (42.7%) of elementary-secondary funding, while state governments provided the greatest share of funding at 43.7% ($383.9 billion). In terms of expenditure, public elementary-secondary school systems allocated $857.3 billion in FY 2022, with instructional salaries accounting for the largest portion of total expenditures at 31.1%.
Debt Dynamics

Total school district debt increased by 2.1% from $532.5 billion in FY 2021 to $543.9 billion in FY 2022. Despite the substantial increase in spending per pupil, this uptick in debt highlights the complex financial landscape faced by school districts across the nation. Balancing investments in educational resources with fiscal responsibility remains a key challenge for policymakers and education administrators alike.
Implications for Educational Equity

While the surge in per-pupil spending signifies a significant investment in public education, disparities persist across states and regions. Addressing these inequities in educational funding is essential to ensure that all students have access to quality education regardless of their geographical location or socioeconomic background. Policymakers must prioritize equity-focused initiatives to bridge the gap and create a more inclusive educational landscape.
Future Outlook

As policymakers and educators navigate the evolving landscape of public school financing, a comprehensive understanding of spending trends and revenue sources is crucial. By leveraging data-driven insights and adopting proactive strategies, stakeholders can work towards fostering a more equitable and sustainable education system that empowers students and prepares them for success in an increasingly complex world.
Impact on the Quality of Education
What do you think? How might the significant disparities in per-pupil spending between states impact the quality of education and opportunities available to students across the nation? In what ways can policymakers ensure that the surge in public school spending translates into tangible improvements in educational outcomes, particularly for historically underserved communities?
Equitable Distribution
What role do local communities play in advocating for equitable distribution of educational resources and holding policymakers accountable for transparent and effective allocation of funds? How can states with the lowest per pupil spending learn from those with the highest expenditures to implement more effective budgeting and resource allocation strategies?
Source: United States Census Bureau


