
In an unsettling trend sending shockwaves through the American housing market, 15 major cities have reported a significant decline in housing affordability according to Point2Homes. This crisis, unfolding across a diverse set of American cities, is not just a series of numbers but a narrative of real people grappling with the ever-growing challenge of finding a place to call home in today’s economic climate.
Lincoln, NE

In 2023, Lincoln experienced a decrease in affordable home prices from $229,706 to $191,053 and a drop in affordable square footage from 1557 to 1260. Despite an increase in median household income from $62,391 to $65,261, the buying power decreased by $38,653.
Tulsa, OK

Tulsa’s affordable home prices fell from $203,019 to $168,061, and the affordable square footage reduced from 1575 to 1234. The median household income increased from $54,040 to $56,526, yet the buying power diminished by $34,958.
Oklahoma City, OK

The city saw affordable home prices decrease from $237,174 to $206,423 and affordable square footage decline from 1603 to 1343. The median household income rose from $63,713 to $66,644, but buying power fell by $30,751.
Kansas City, MO

Kansas City noted a decrease in affordable home prices from $247,645 to $217,950 and in square footage from 1615 to 1389. The median household income increased from $62,175 to $65,035, with a buying power drop of $29,694.
Wichita, KS

Affordable home prices in Wichita decreased from $219,627 to $190,337, and square footage went down from 1958 to 1645. Median household income grew from $59,277 to $62,004, with a reduction in buying power of $29,290.
Corpus Christi, TX

In Corpus Christi, affordable home prices slightly decreased from $219,274 to $196,291, and square footage saw a minor reduction from 1282 to 1242. The median household income increased from $60,958 to $63,762, with a decrease in buying power of $22,983.
St. Paul, MN

The city experienced a decrease in affordable home prices from $258,519 to $236,116 and in square footage from 1388 to 1242. Despite the median household income rising from $67,725 to $70,840, buying power fell by $22,403.
Santa Ana, CA

Santa Ana saw a reduction in affordable home prices from $337,765 to $315,581 and in square footage from 624 to 575. The median household income increased from $79,351 to $83,001, but buying power decreased by $22,184.
Omaha, NE

Omaha’s affordable home prices decreased from $227,341 to $205,285, and square footage dropped from 1612 to 1387. The median household income went up from $67,450 to $70,553, with a buying power reduction of $22,056.
El Paso, TX

In El Paso, affordable home prices fell from $178,136 to $156,600, and square footage decreased from 1296 to 1066. The median household income increased from $52,645 to $55,067, yet buying power decreased by $21,536.
Lexington, KY

Lexington experienced a decrease in affordable home prices from $248,186 to $227,029 and in square footage from 1526 to 1298. The median household income grew from $62,908 to $65,802, with a reduction in buying power of $21,158.
Lubbock, TX
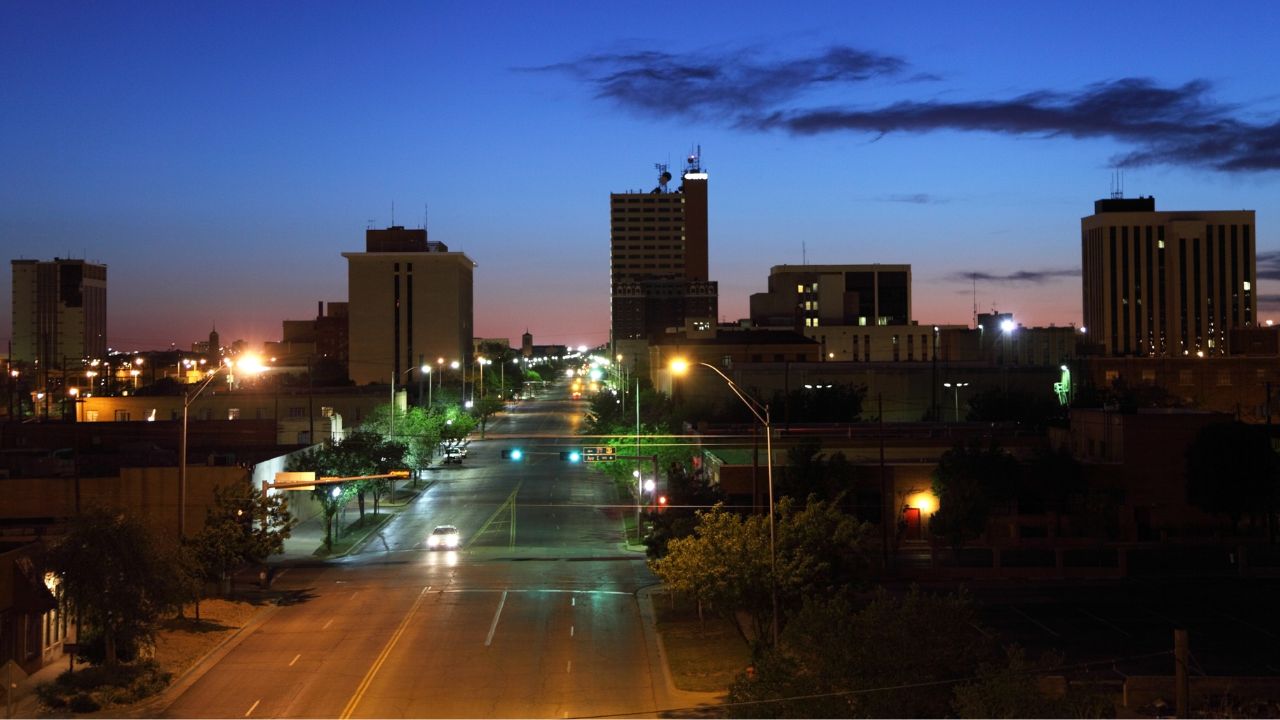
Affordable home prices in Lubbock decreased from $202,349 to $181,761, and square footage reduced from 1497 to 1336. The median household income increased from $56,910 to $59,528, with a decrease in buying power of $20,588.
Winston-Salem, NC

The city saw a decrease in affordable home prices from $220,276 to $201,094 and in square footage from 1458 to 1221. Despite an increase in median household income from $54,195 to $56,688, the buying power fell by $19,182.
Fort Worth, TX

Fort Worth noted a slight decrease in affordable home prices from $246,435 to $228,223 and in square footage from 1318 to 1265. The median household income rose from $71,527 to $74,817, with a decrease in buying power of $18,213.
Detroit, MI
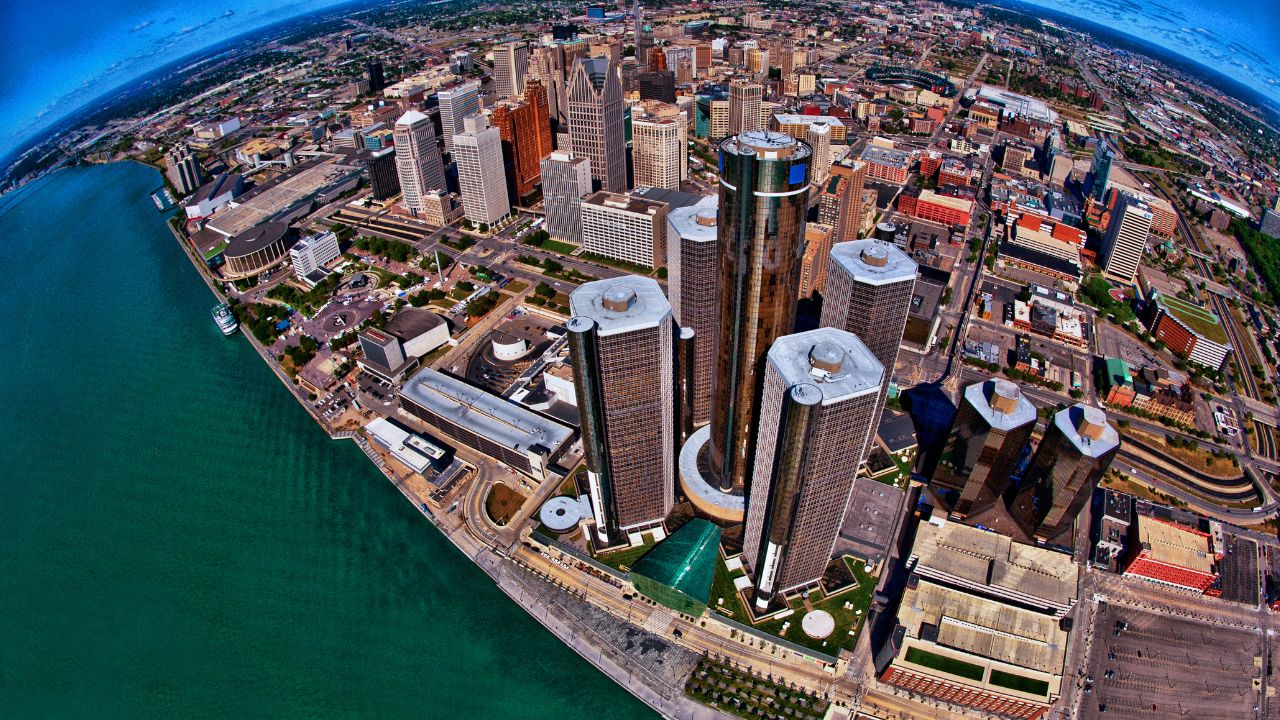
In Detroit, there was a notable decrease in affordable home prices from $129,193 in 2022 to $111,750 in 2023, alongside a significant reduction in affordable square footage from 1997 to 1624. Despite an increase in median household income from $36,453 in 2022 to $38,130 in 2023, the buying power decreased by $17,443, reflecting a challenging shift in the housing market.


