
The decision between owning a home and renting has become a focal point in today’s housing market, significantly influencing people’s personal and family lives. Recent years have witnessed dramatic changes in the dynamics of housing.
The perception of homeownership has shifted, moving from being considered the ultimate embodiment of the American dream to the increasing popularity of renting as a pragmatic choice. It’s no longer just about finding a place to live; it has evolved into a complex decision shaped by societal changes, economic realities, and individual preferences.
As we reveal the data, this page aims to provide insights into the distinctions between homeowners and renters, offering perspectives on affordability, vacancy rates, demographics, and a glimpse into the modern housing landscape.
Key Takeaways
- The residential real estate market is valued at approximately $2.53 trillion.
- As of the second quarter of 2023, the national homeownership rate is 65.9%.
- The mortgage approval rate for home buyers stood at 80.68% in 2022.
- Multigenerational homes represented 11% of all homes sold in 2022.
- Approximately 102 million Americans live in rental housing, occupying around 44.1 million housing units.
- 80% of renters consider the affordability of a property as the most crucial home characteristic.
- In 2023, the qualifying income required to afford a starter home is $96,576, while the median income of prime first-time homebuyers is $59,326.
- In 2020, 23% of renters were classified as “severely cost-burdened.”
- There is projected to be a net growth of 6.9 million new homeowner households by 2040.
- Baby Boomers comprise the largest share of homeowners, accounting for 39%.
- The median age of renters is 39 years.
- White households had the highest homeownership rate, at 72.1%.
- Single women owned the majority, or 58%, of the approximately 35.2 million homes owned by unmarried Americans in 2022.
- Individuals who live alone constitute the largest segment of renters, comprising 38.1%.
- West Virginia has the highest homeownership rate among states, standing at 73.7%.
- Hawaii has the highest average monthly rent among U.S. states, at $1,651.
Homeownership statistics
Homeownership was once an attainable dream but has become increasingly elusive for many Americans, particularly as they contend with the challenges posed by the high cost of living. Over time, homeownership rates have gradually declined, driven by soaring housing prices that outpace income growth, alongside the surge in interest rates. In light of these prevailing market conditions, let’s examine data regarding fluctuations in homeownership and explore related factors.
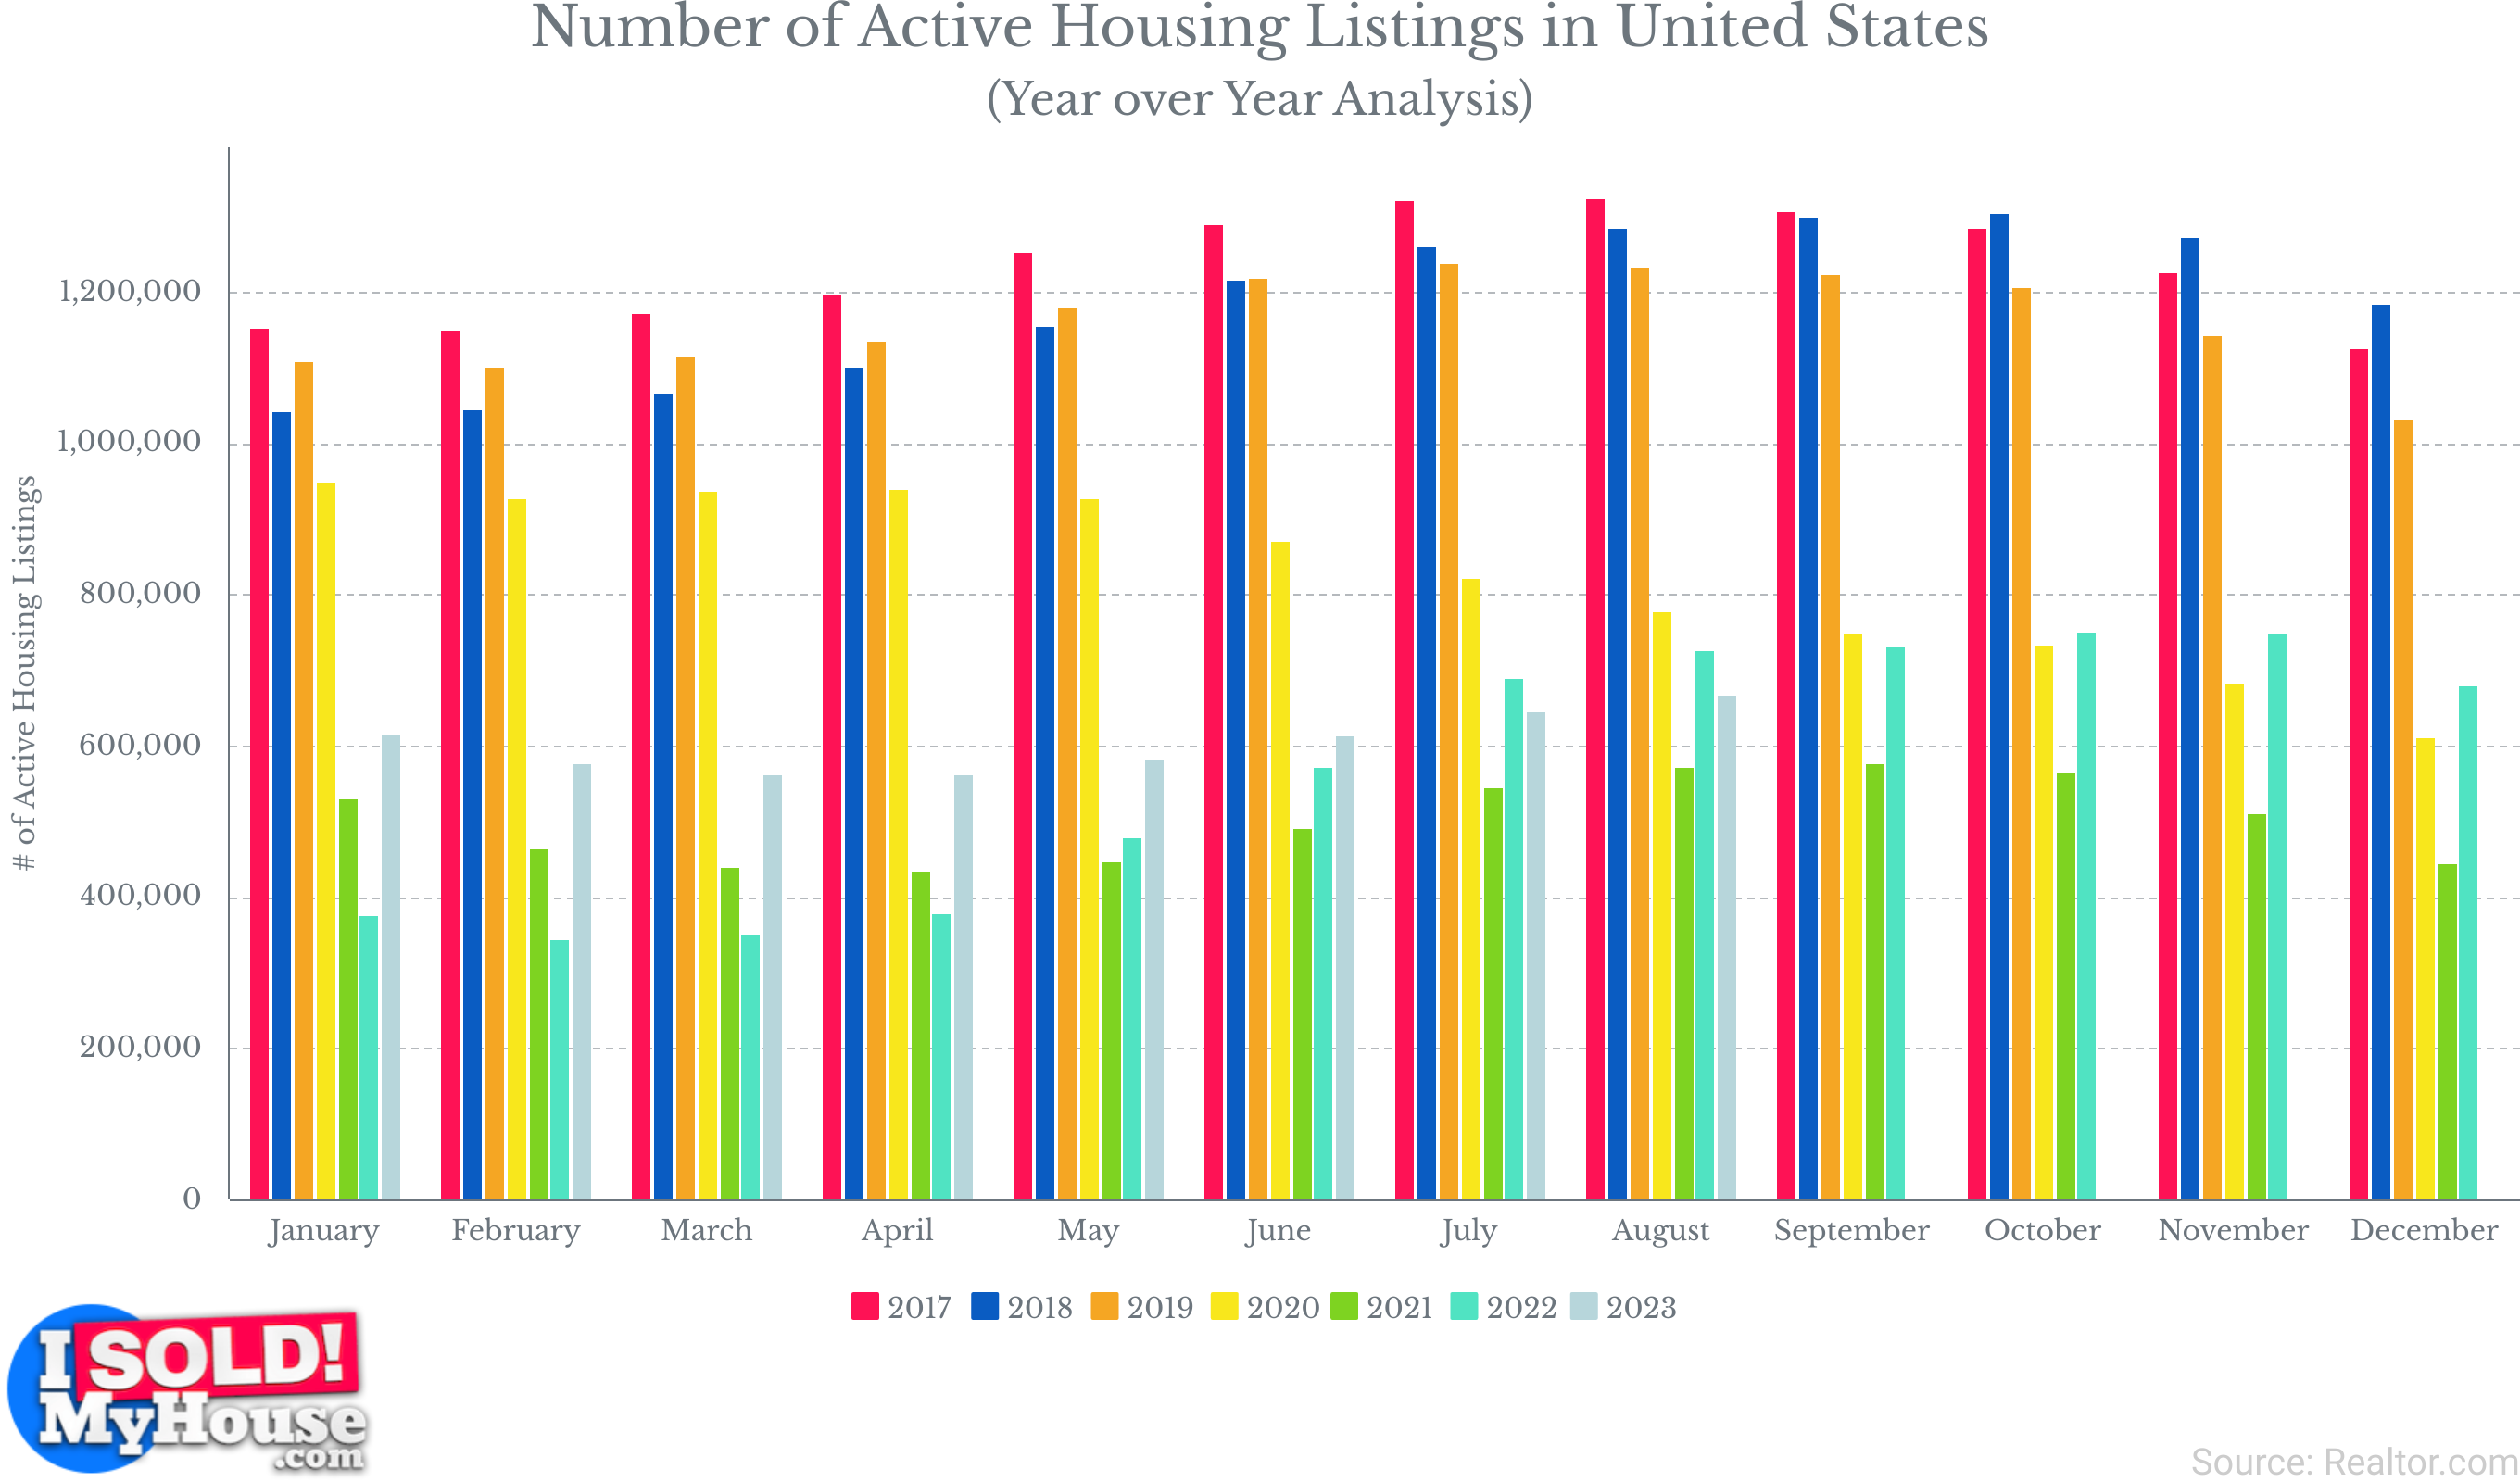
- In February 2022, the United States witnessed the lowest number of active housing listings in at least five years, with a mere 346,141 listings available on the market. This represents a substantial 60% decline from the approximately 1 million listings recorded in February 2020, just prior to the onset of the coronavirus recession in the U.S.
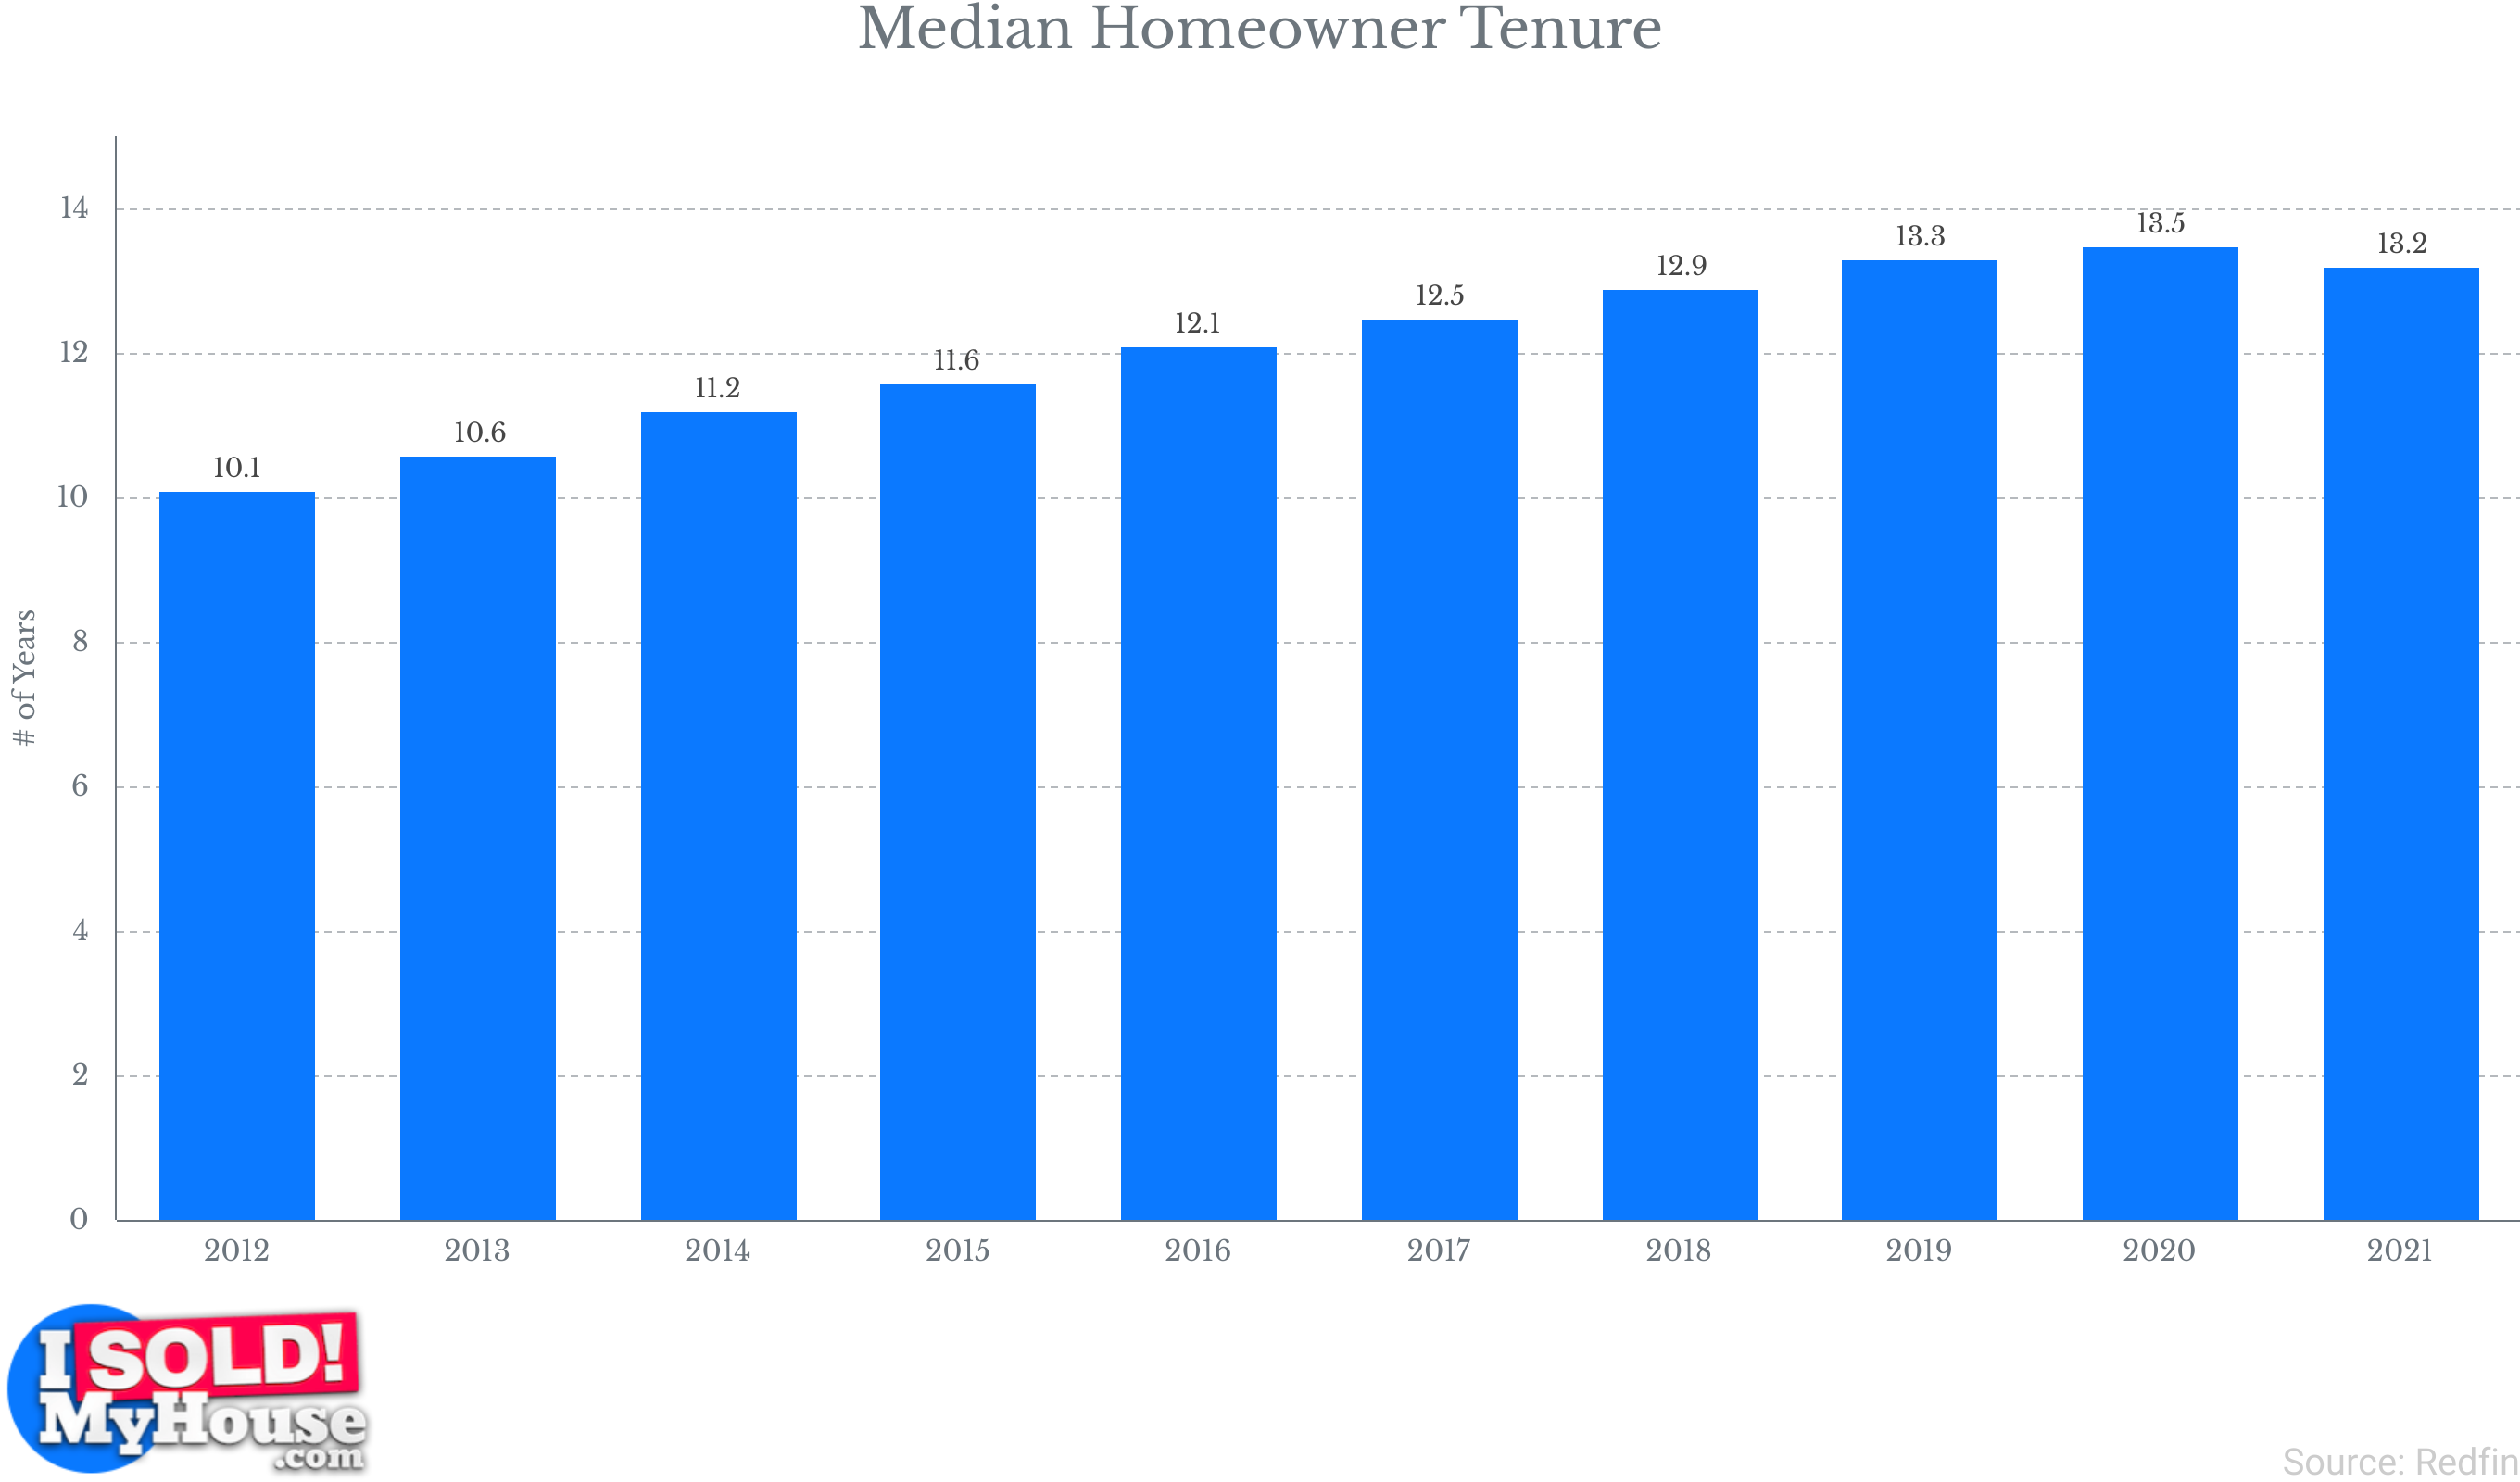
- In 2021, the average homeowner tenure remained nearly unchanged from its 2020 peak, standing at 13.2 years. Comparatively, homeowner tenure in 2020 was 13.5 years, marking a substantial rise from 10.1 years in 2012.
- Between 2020 and 2040, there is projected to be a net growth of 6.9 million new homeowner households in America.
- In 2022, first-time homebuyers comprised 26% of all buyers, marking a decrease from the previous year when they accounted for 34% of the market.
- Despite the fluctuations in the market, a significant 63% of American homeowners express positivity, with many feeling very positive, about their homeownership experience. Interestingly, 71% of Millennial homeowners and an even higher 73% of Gen Z homeowners report feeling confident and secure in their decision to own a home.
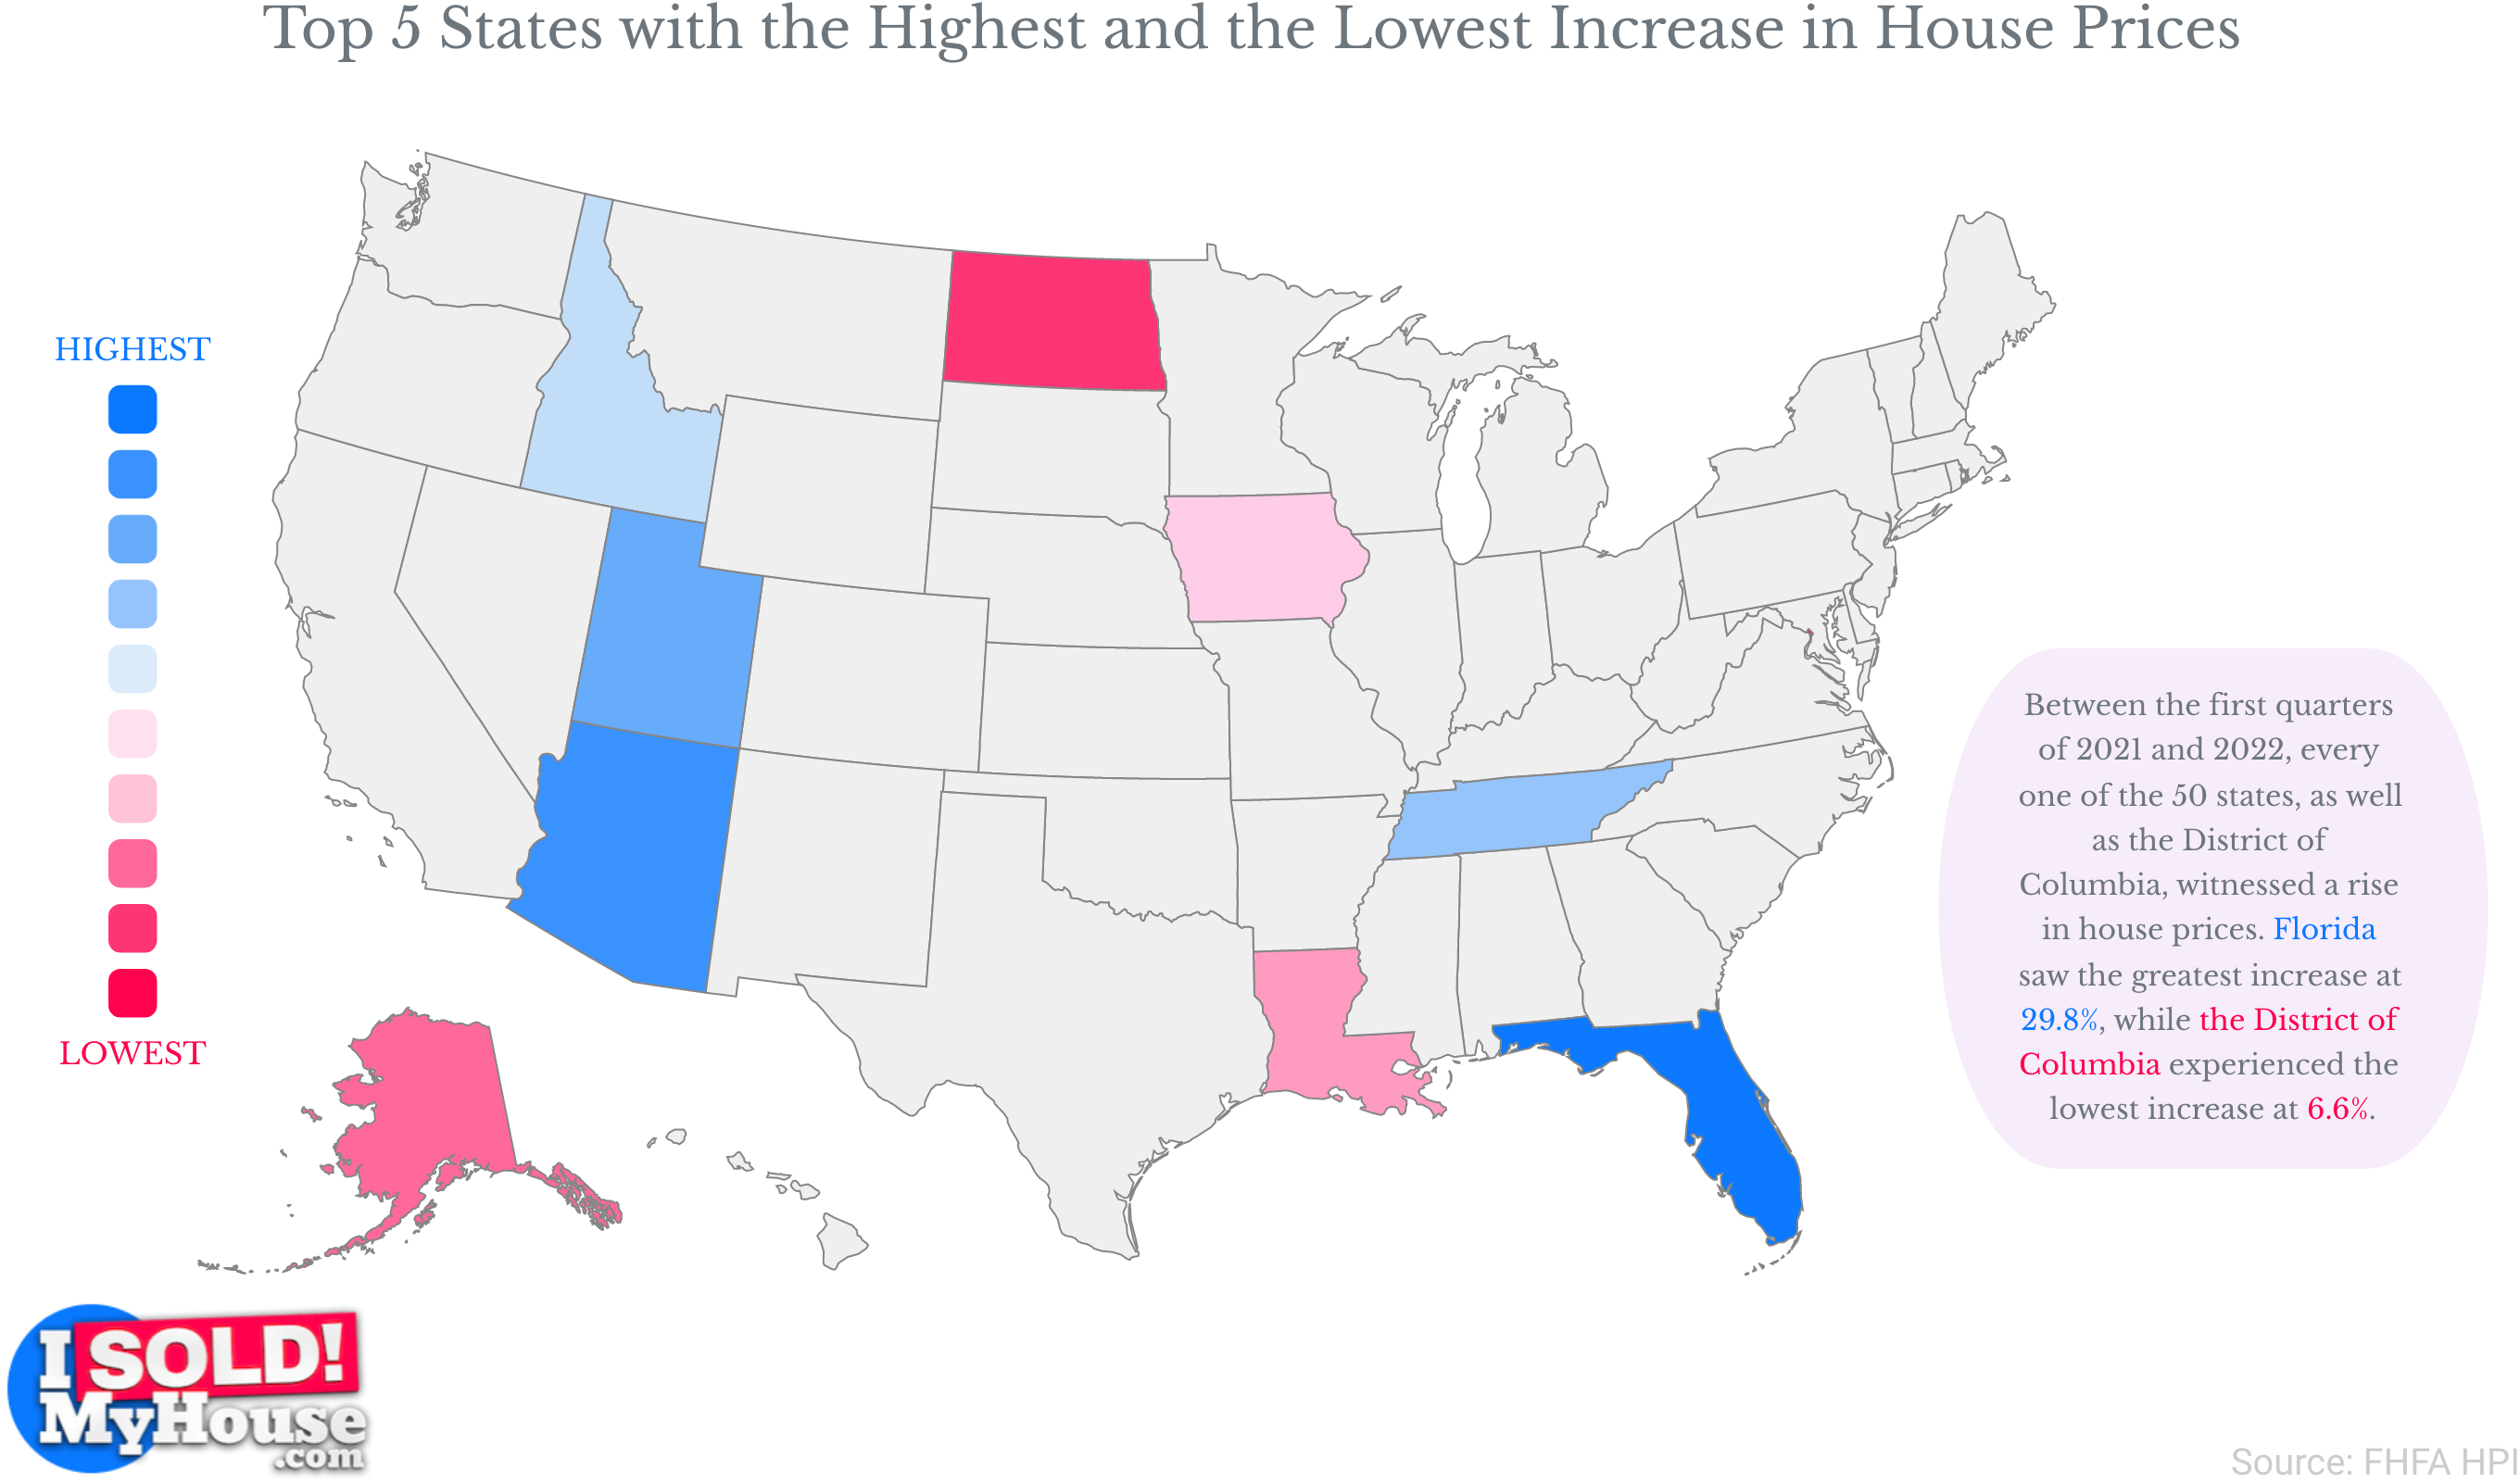
- Between the first quarter of 2021 and the first quarter of 2022, housing prices experienced a significant increase of 18.7%. However, from the second quarter of 2022 to the second quarter of 2023, prices dropped by 6.5%.
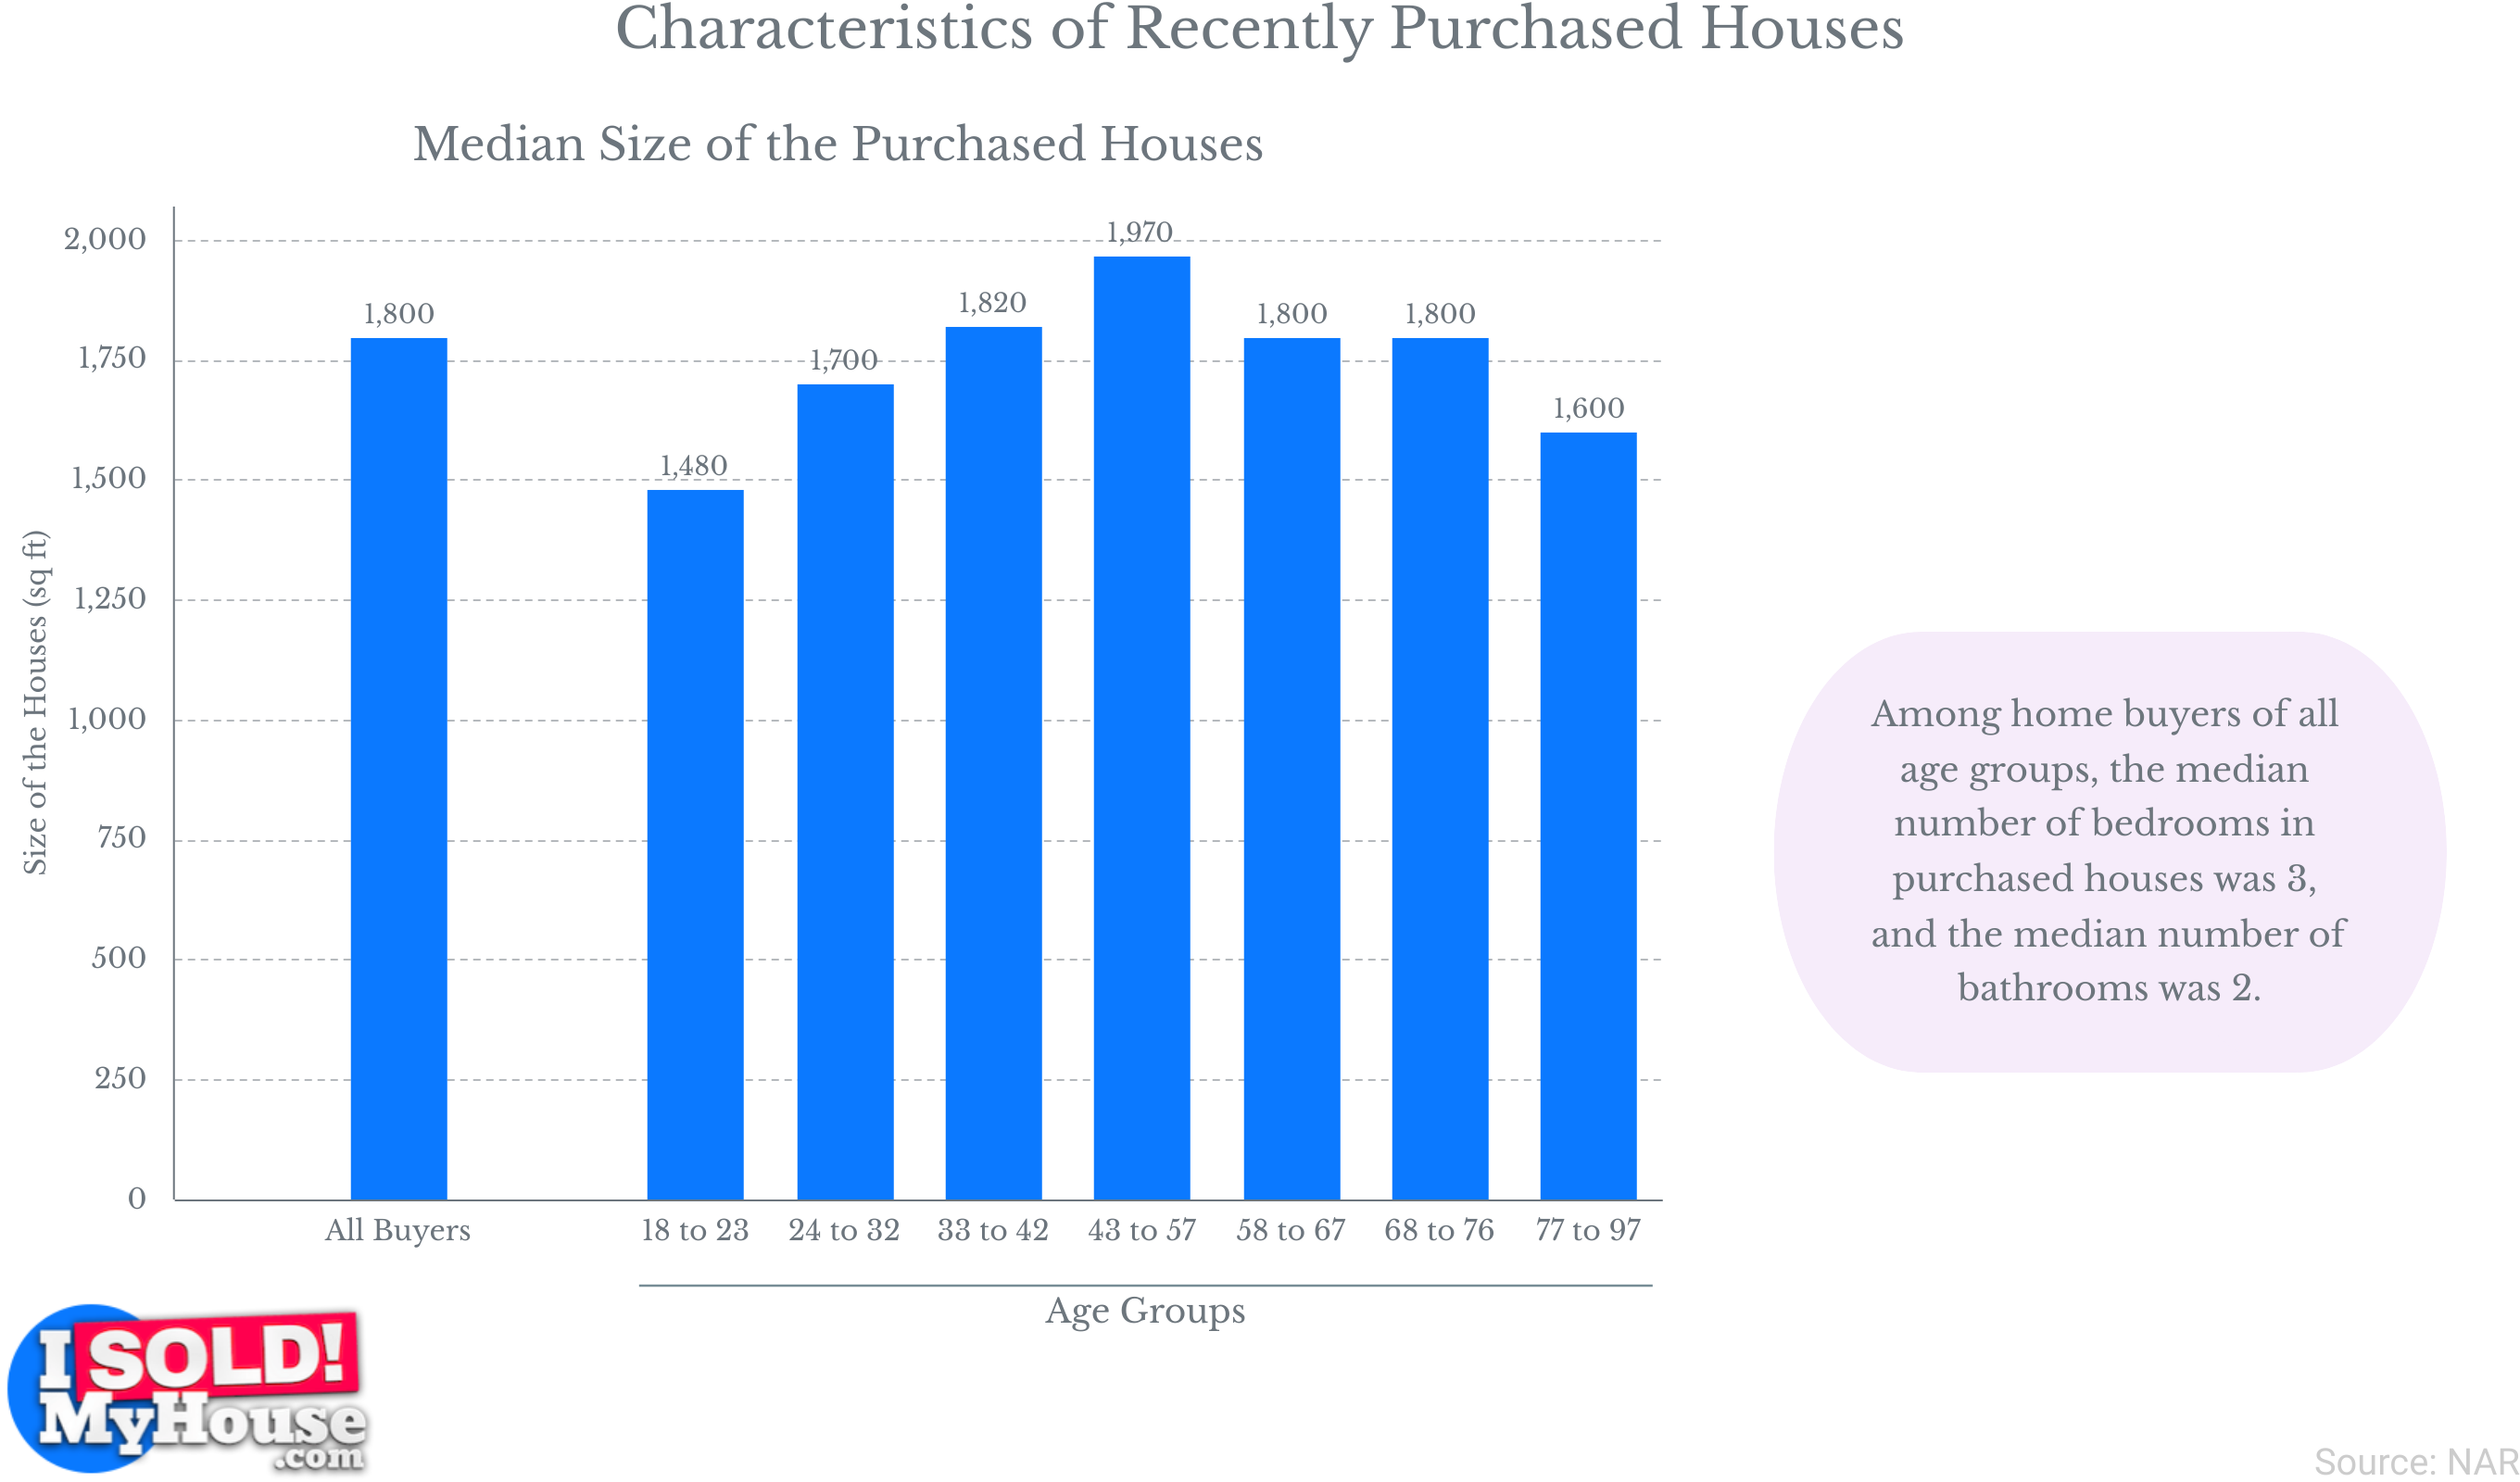
- In 2023, a typical newly purchased home is around 1,800 square feet, usually featuring three bedrooms and two bathrooms.
- In 2022, multigenerational homes accounted for 11% of all homes sold. These homes are predominantly purchased by families that include both aging parents and young children.
- In 2021, a significant number of homeowners, totaling over 5.3 million, had intentions of relocating within the next 12 months. These relocation plans were diversified as follows: 38.3% of homeowners planned to move to a different city, 26.2% intended to relocate to a different neighborhood within the same city, 26% had plans to move to an unspecified location categorized as “somewhere else,” 6.5% aimed to move to a different residence within the same neighborhood, and 3.1% did not specify their relocation plans. These highlight the dynamic nature of housing decisions and the range of choices homeowners considered for their relocation plans in 2021.
Renting statistics
Renting has evolved into a significant facet of the American housing landscape, with millions of individuals opting for renting over homeownership. However, there was once a time when Americans had the freedom to choose between buying and renting.
Presently, renting appears to be the sole viable option for many, owing to economic realities and societal circumstances that impede homeownership. While some Americans rent out of preference and convenience, others find themselves compelled by the escalating housing costs and widening income disparities.
In light of these dynamics, this section delves into the proportion of American households that opt for renting and explores the driving forces behind the surge in renting across the country.
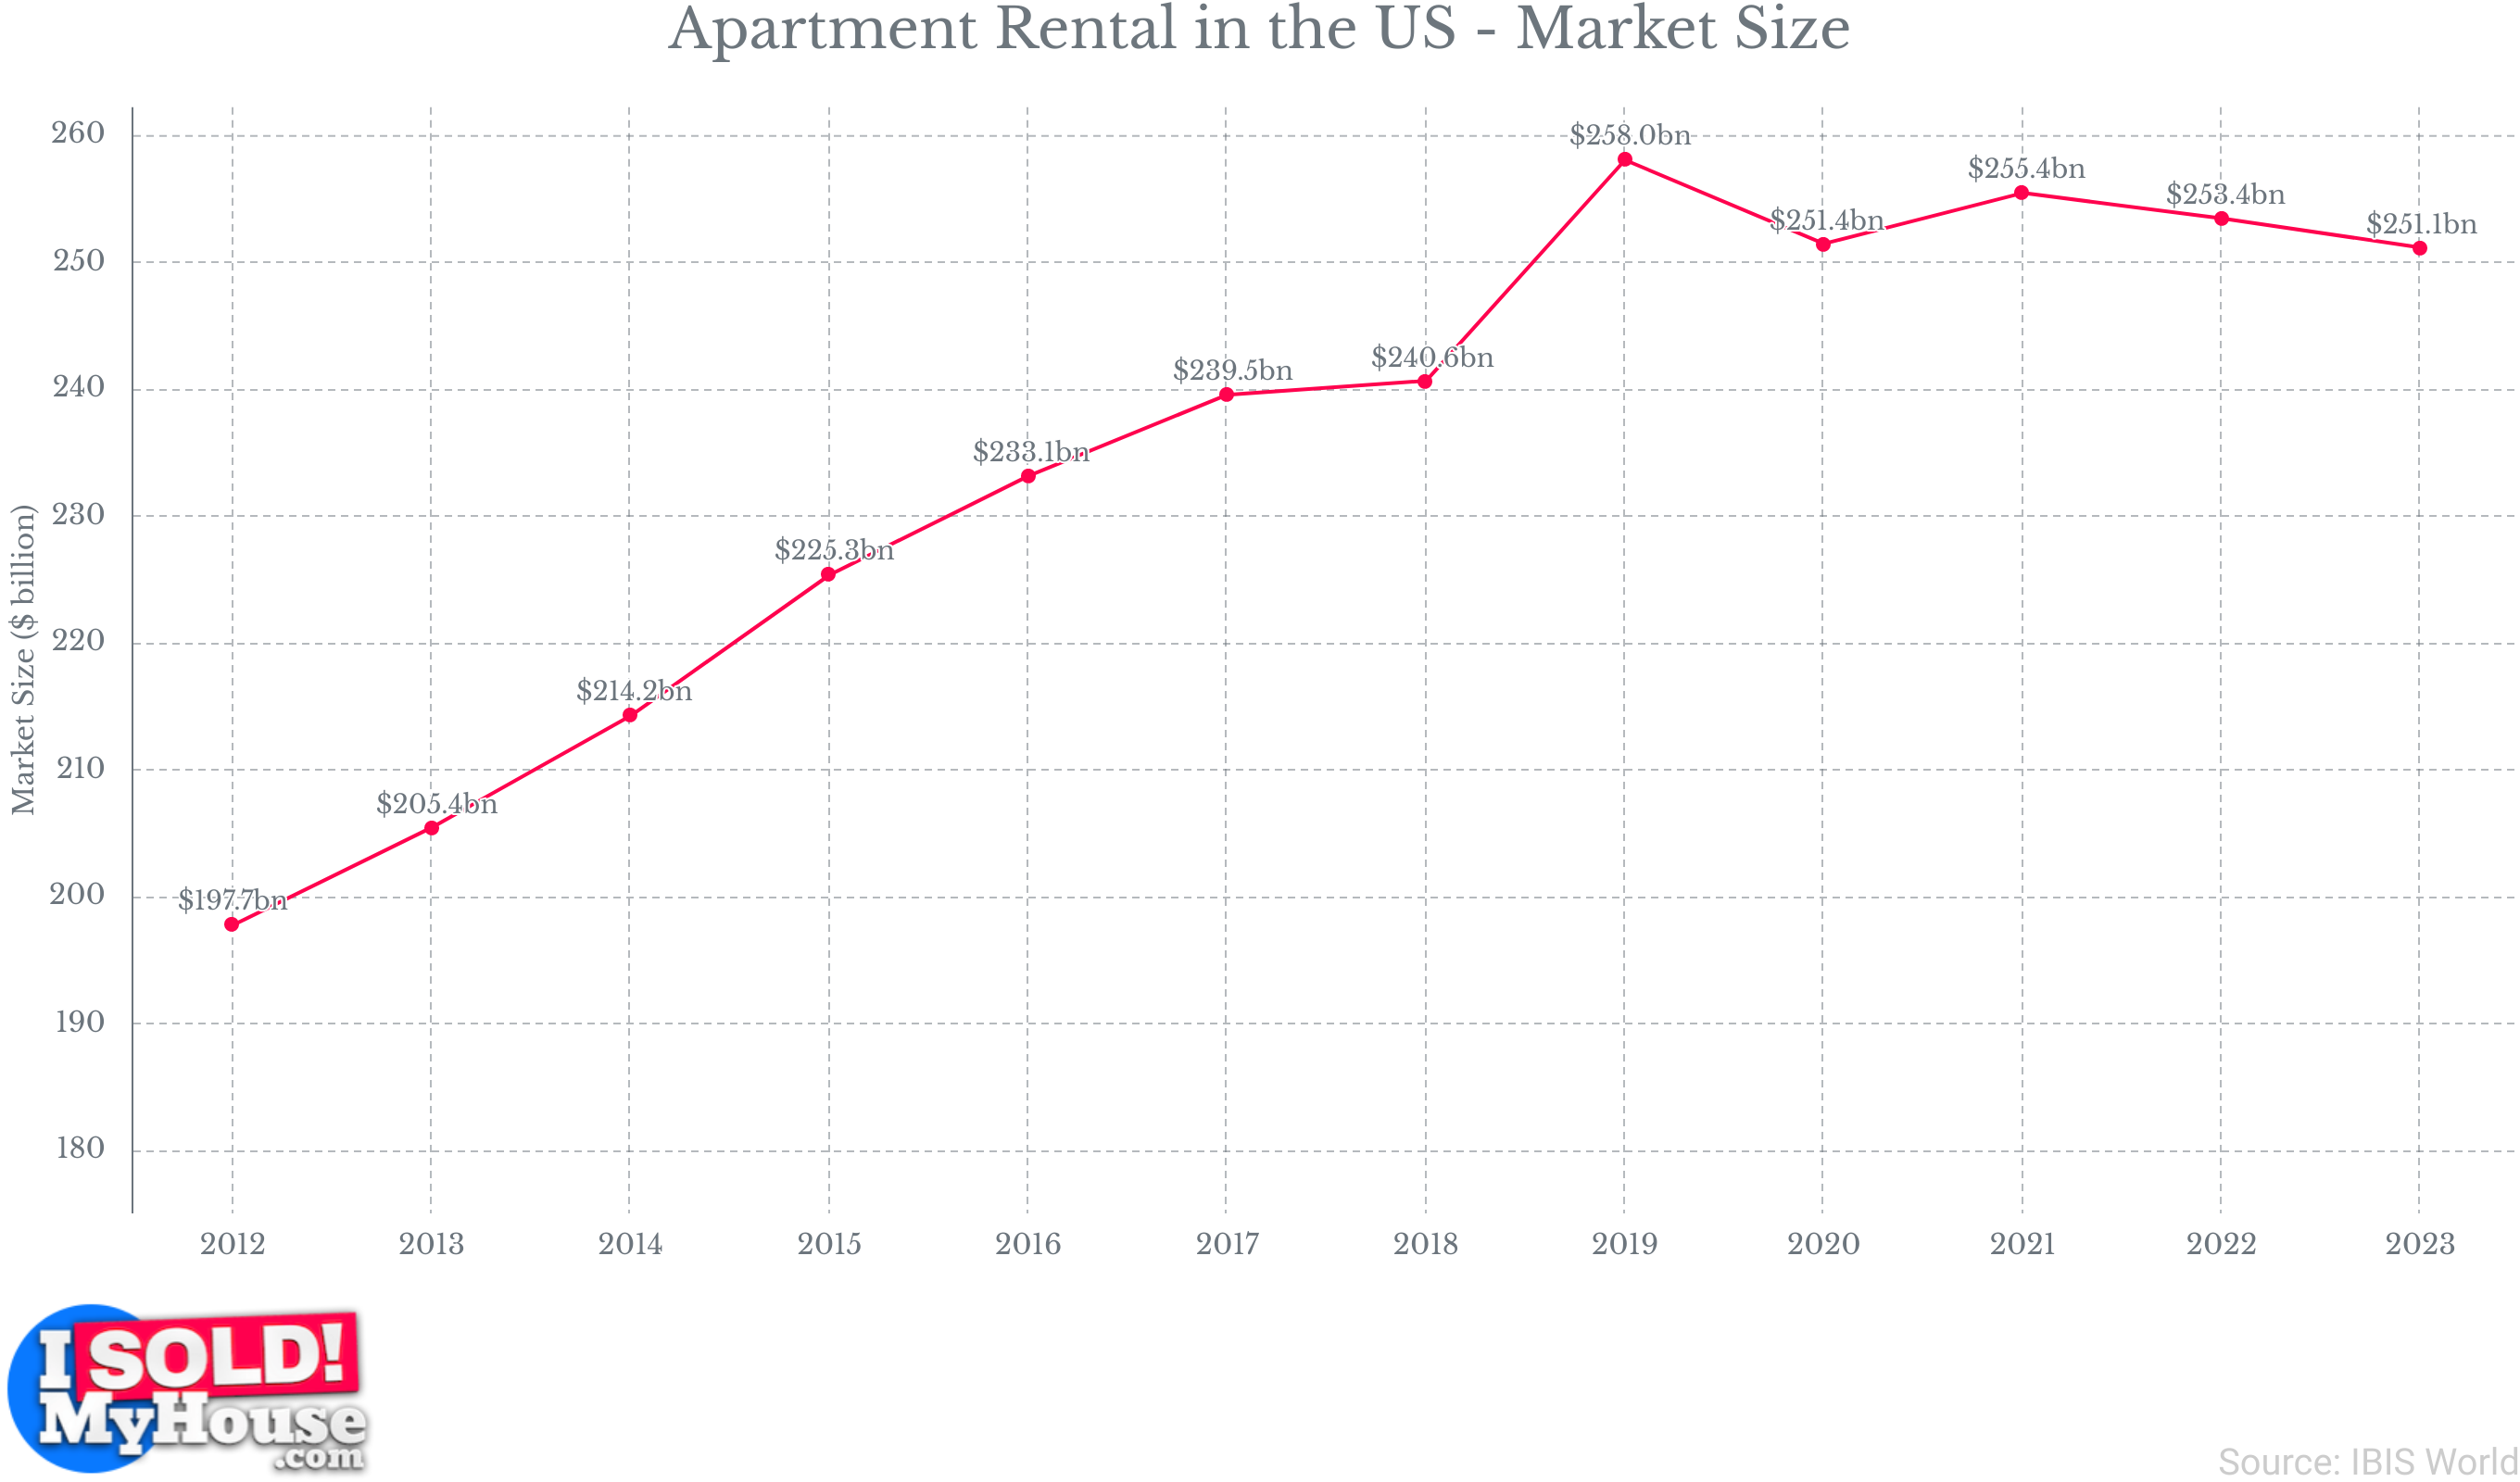
- The apartment rental industry in 2022 had a market size of $258.4 billion. Between 2017 and 2022, the industry growth averaged 1.5% annually. This growth can be attributed to several factors, including the high cost of real estate and homeownership rates, which have made renting apartments a more viable and attractive option for many individuals and families.
- More than 10.6 million Americans derive income from rental properties. This revenue is generated from approximately 17.7 million properties.
- Approximately 102 million Americans reside in rental housing, occupying approximately 44.1 million housing units. Of these renters, 36% reside in apartments, while 41% live in single-family homes.
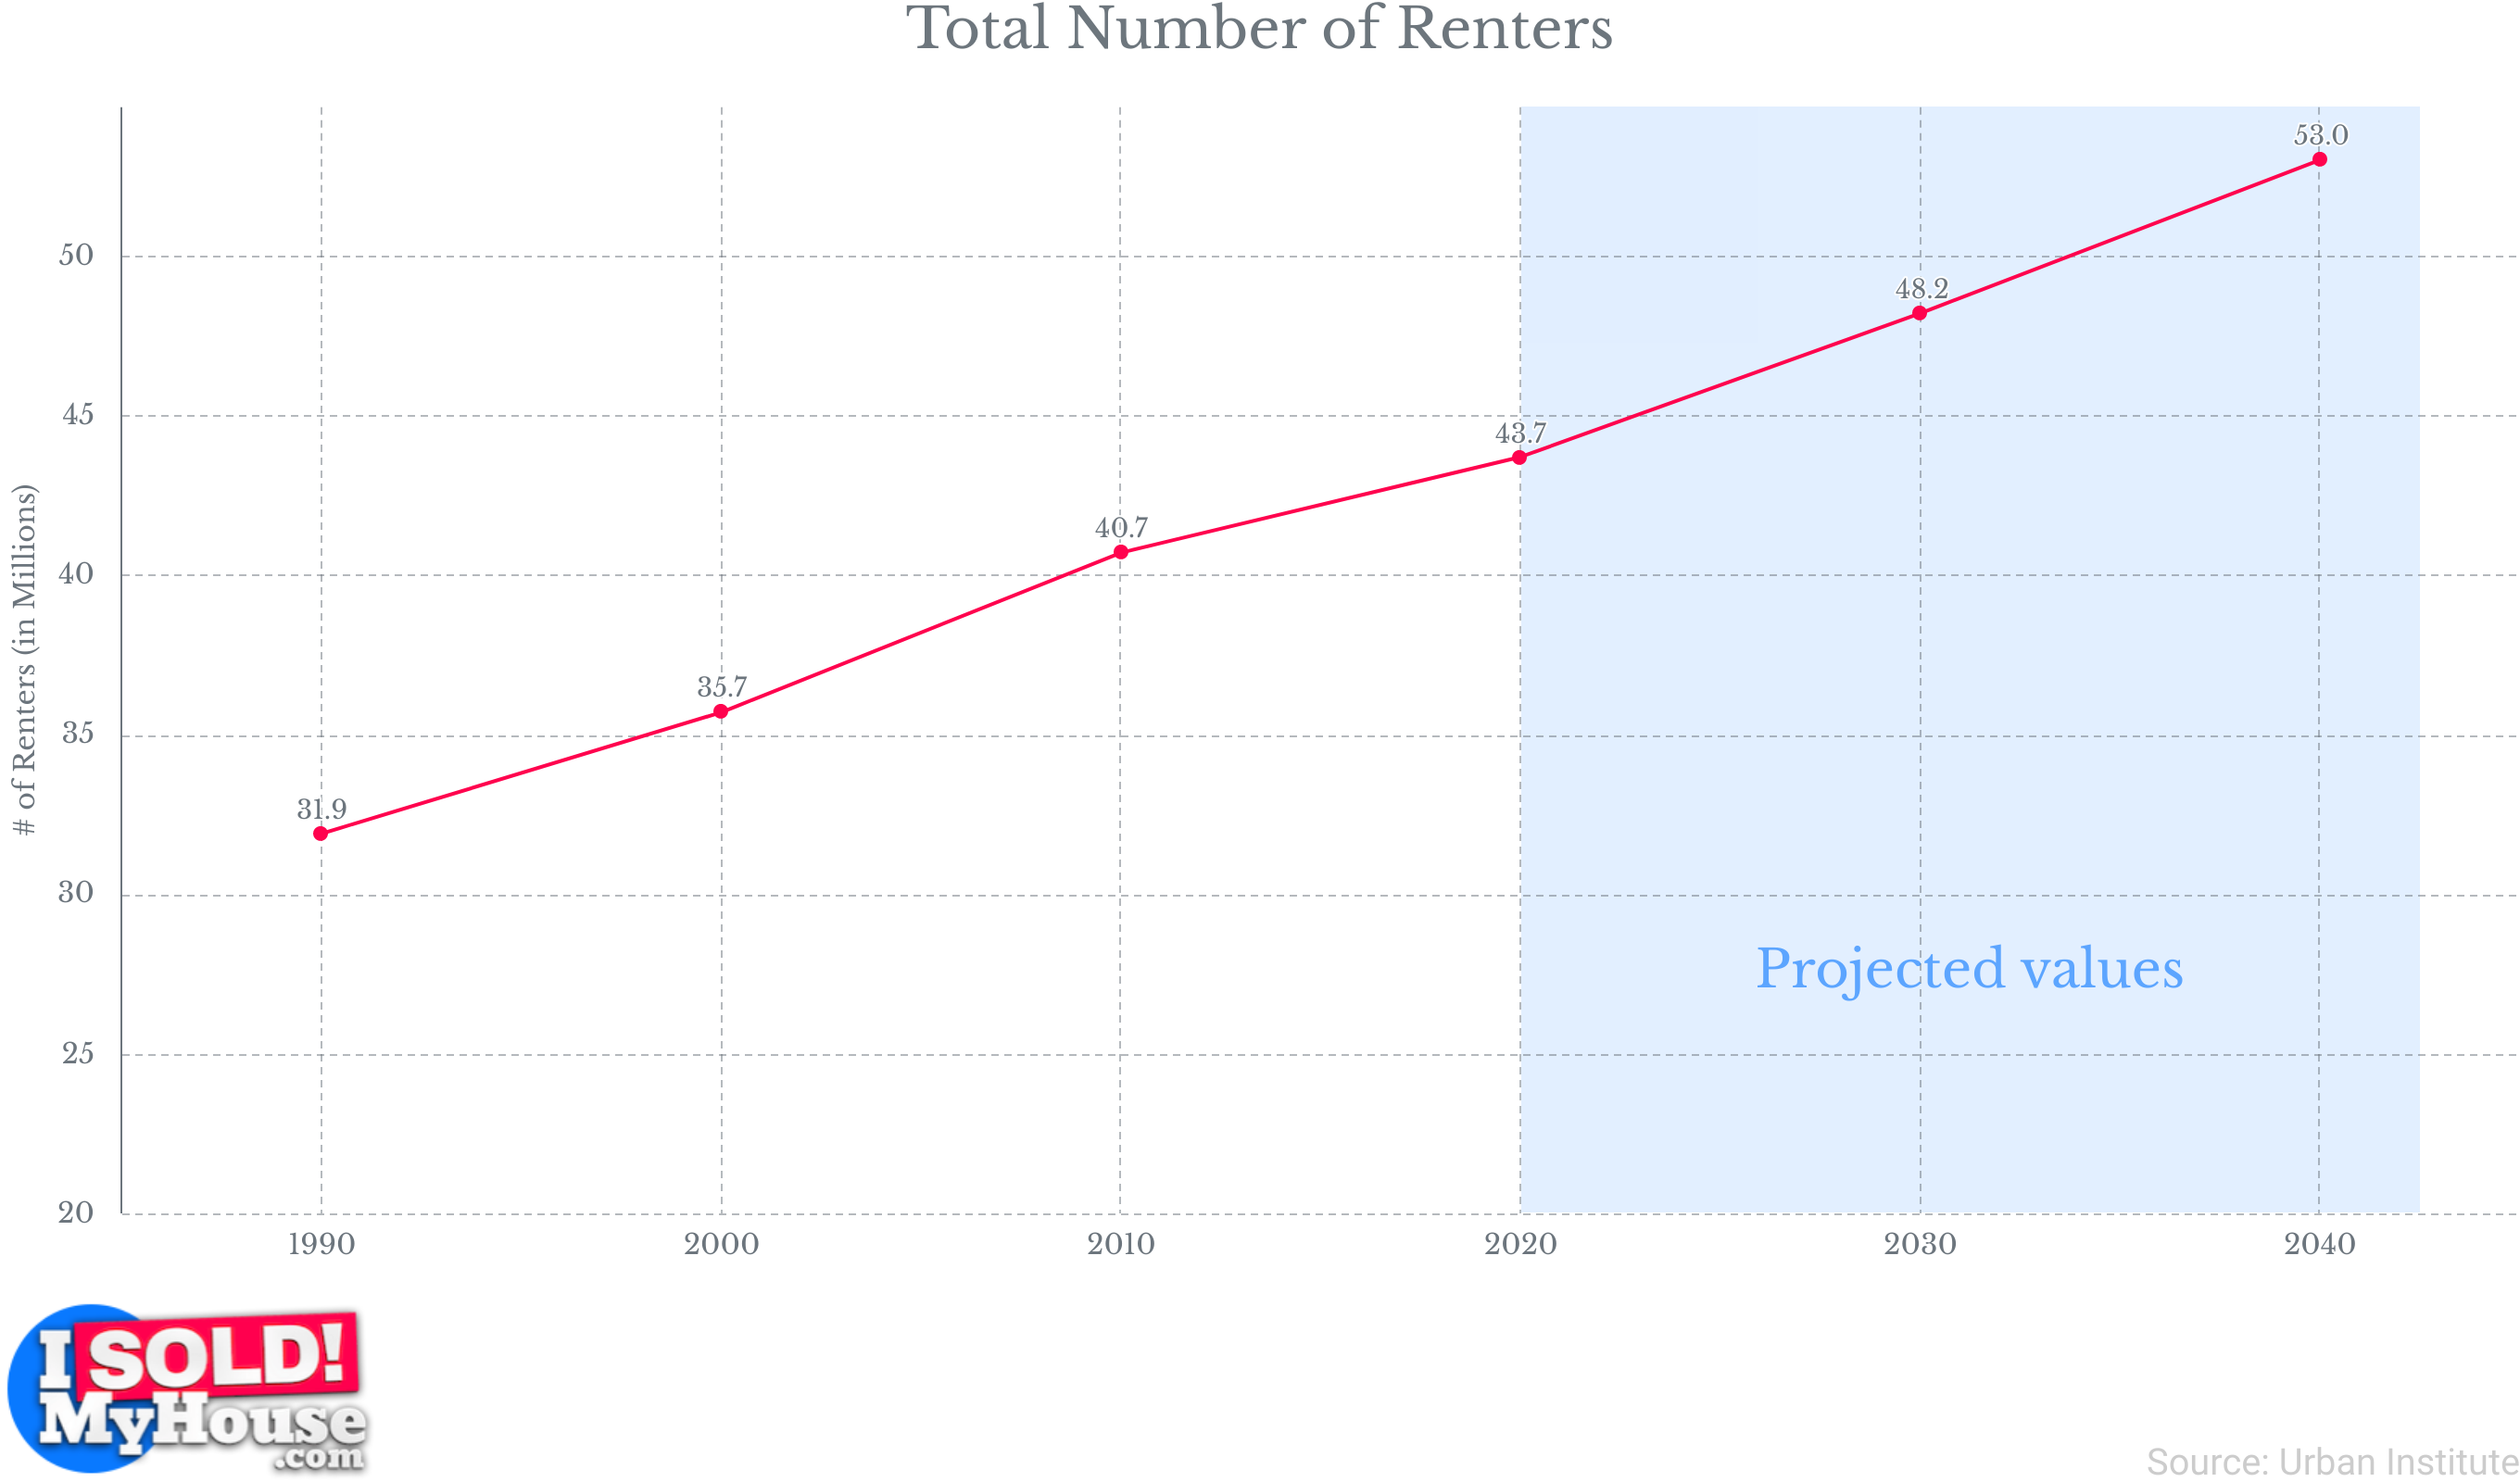
- By 2040, there is projected to be a substantial increase in the number of new renter households, reaching an estimated 9.3 million. This represents a notable growth of 21% compared to the figures from 2020.
- In 2023, the number of renter-occupied households increased to 44.1 million, up from 43.8 million in 2018. In contrast, owner-occupied households numbered 83.4 million in the same year.
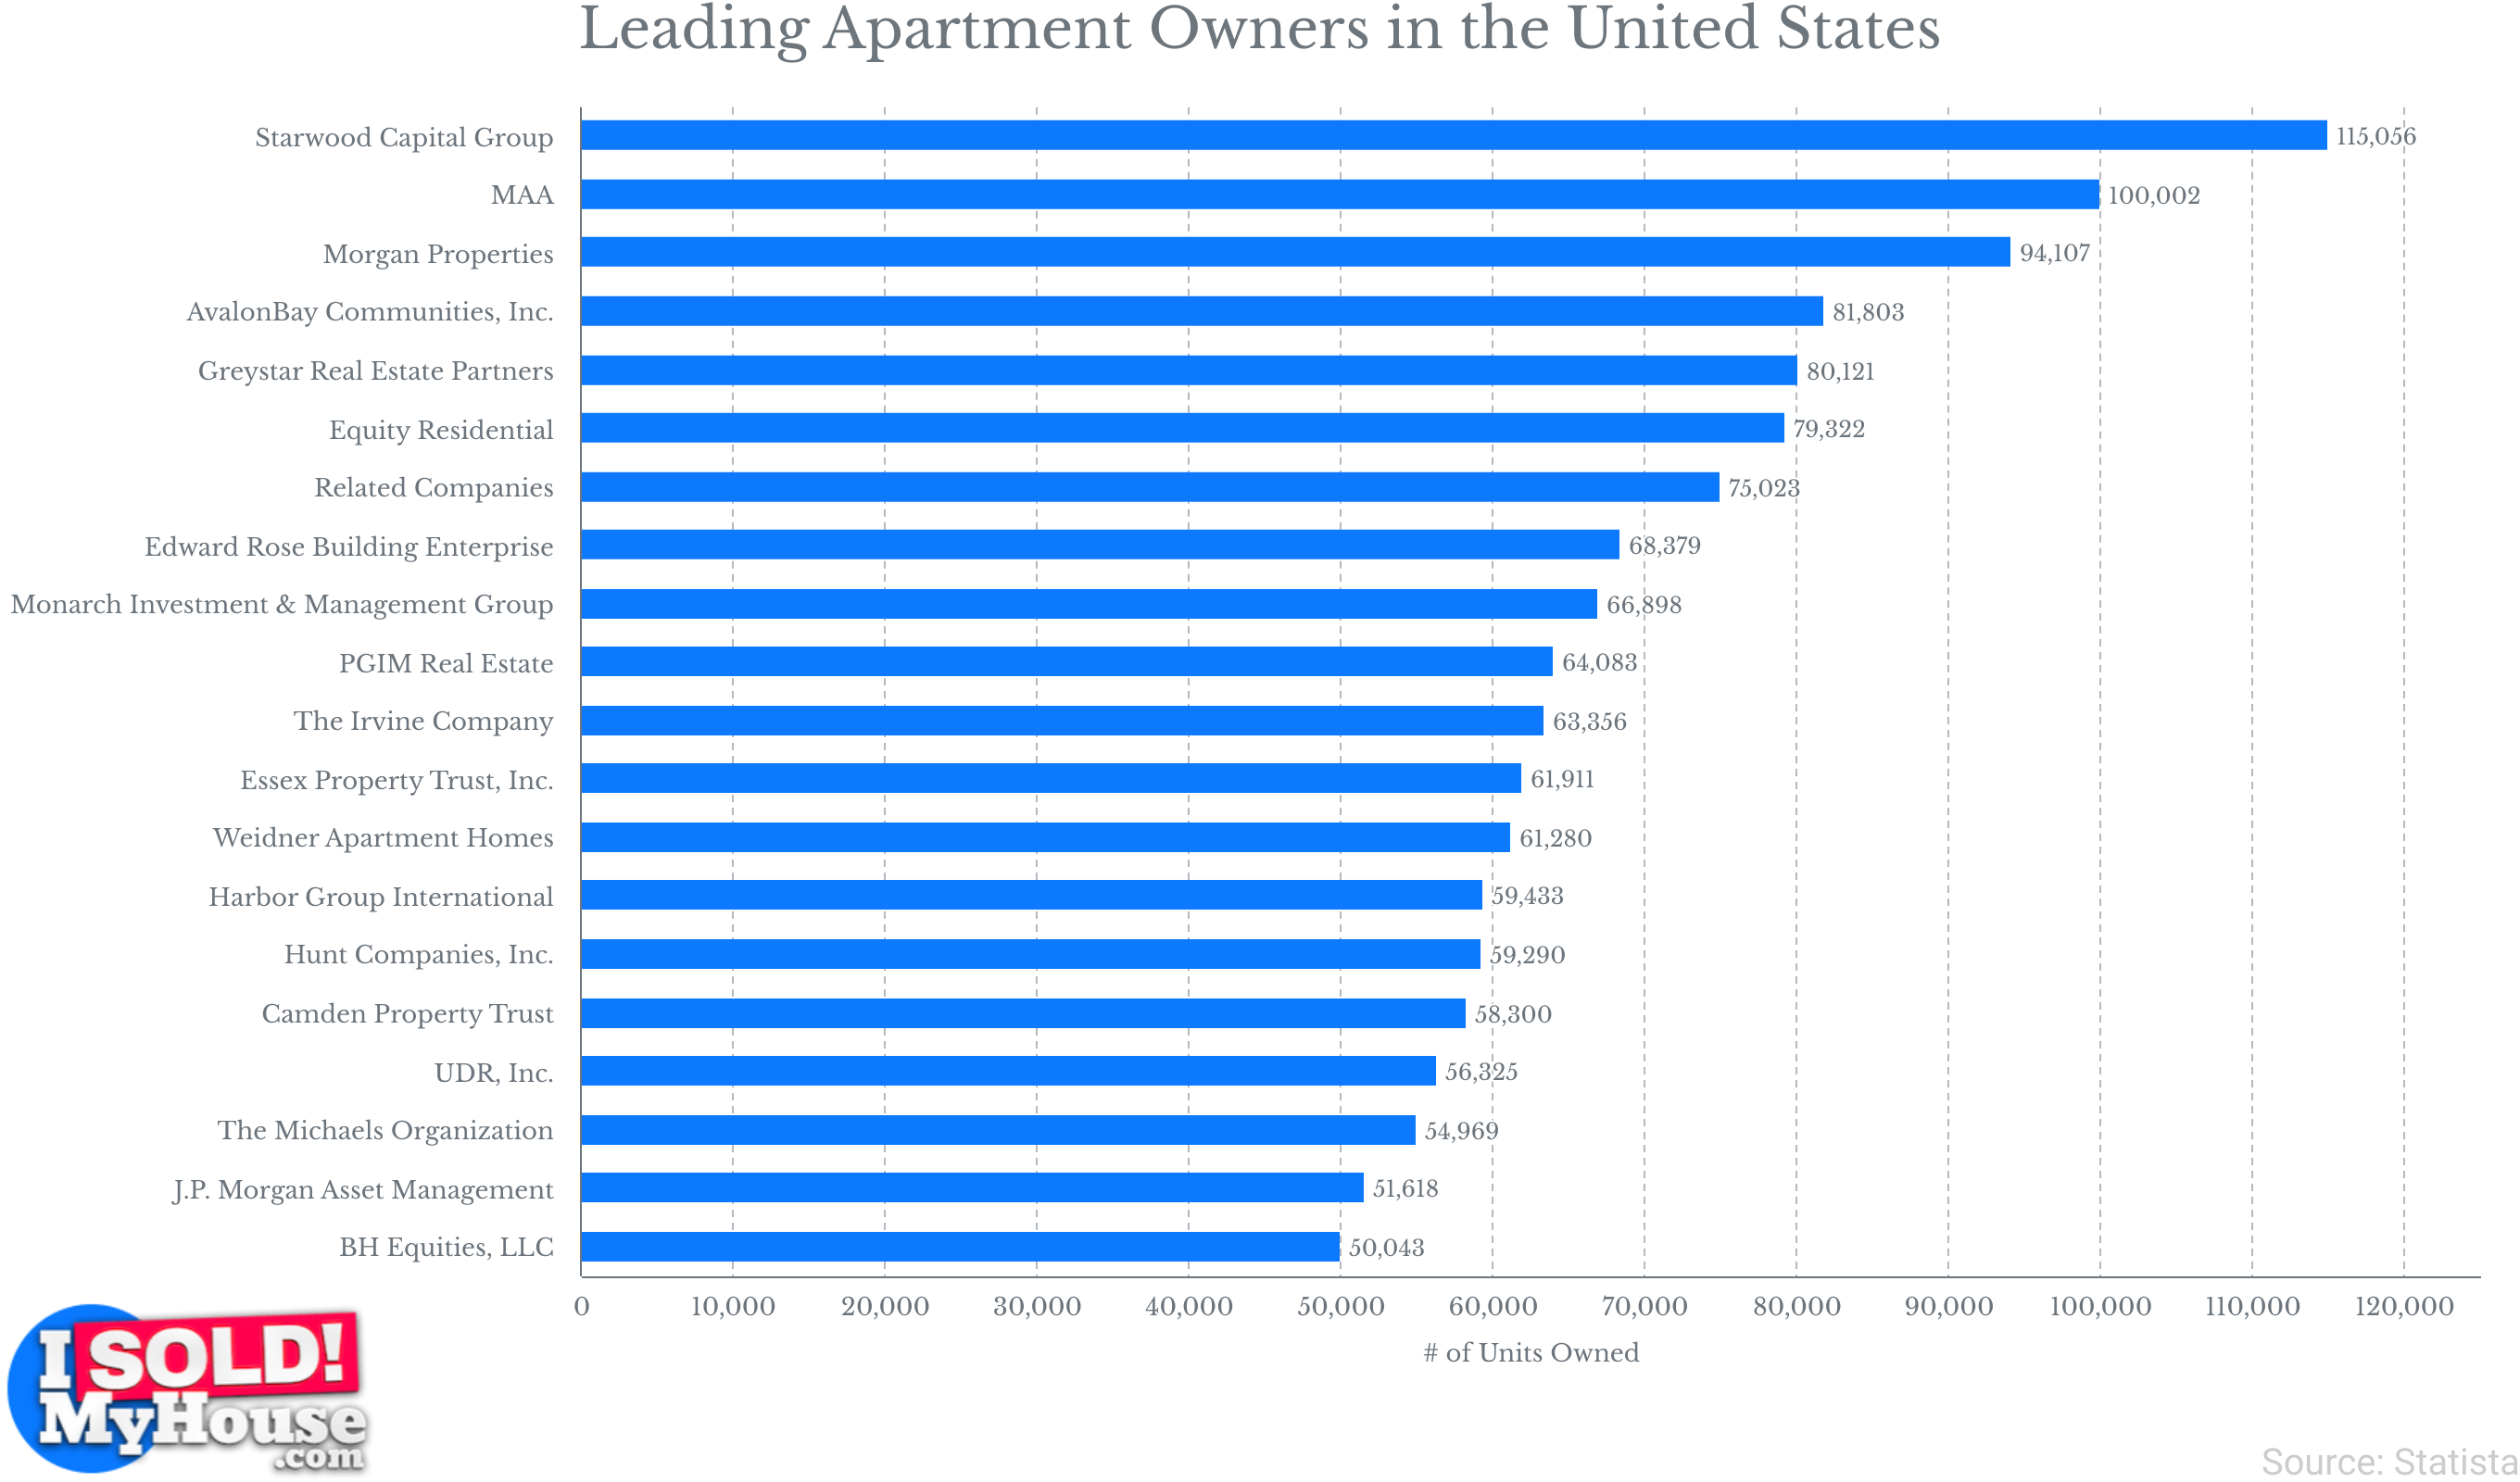
- As of 2022, the largest Real Estate Investment Trust (REIT) in the United States is Starwood Capital Group, a private investment firm headquartered in Miami, Florida. Starwood Capital Group owns a substantial portfolio of 115,000 rental units. Following closely behind is MAA, a REIT based in Tennessee, which boasts ownership of over 100,000 rental units situated in the Southeastern and Southwestern regions of the United States.
- Out of the 50 million rental housing units in the United States, a significant 41% are owned by mom-and-pop landlords. This equates to more than 20 million units managed by individual investor landlords.
- Since the onset of the pandemic, from 2021 to 2022, the cost of renting both one- and two-bedroom apartments has surged, experiencing a notable increase of 24.2%. Florida emerged as the state witnessing the most substantial rise during this period, registering a significant 22.59% increase in rental costs.
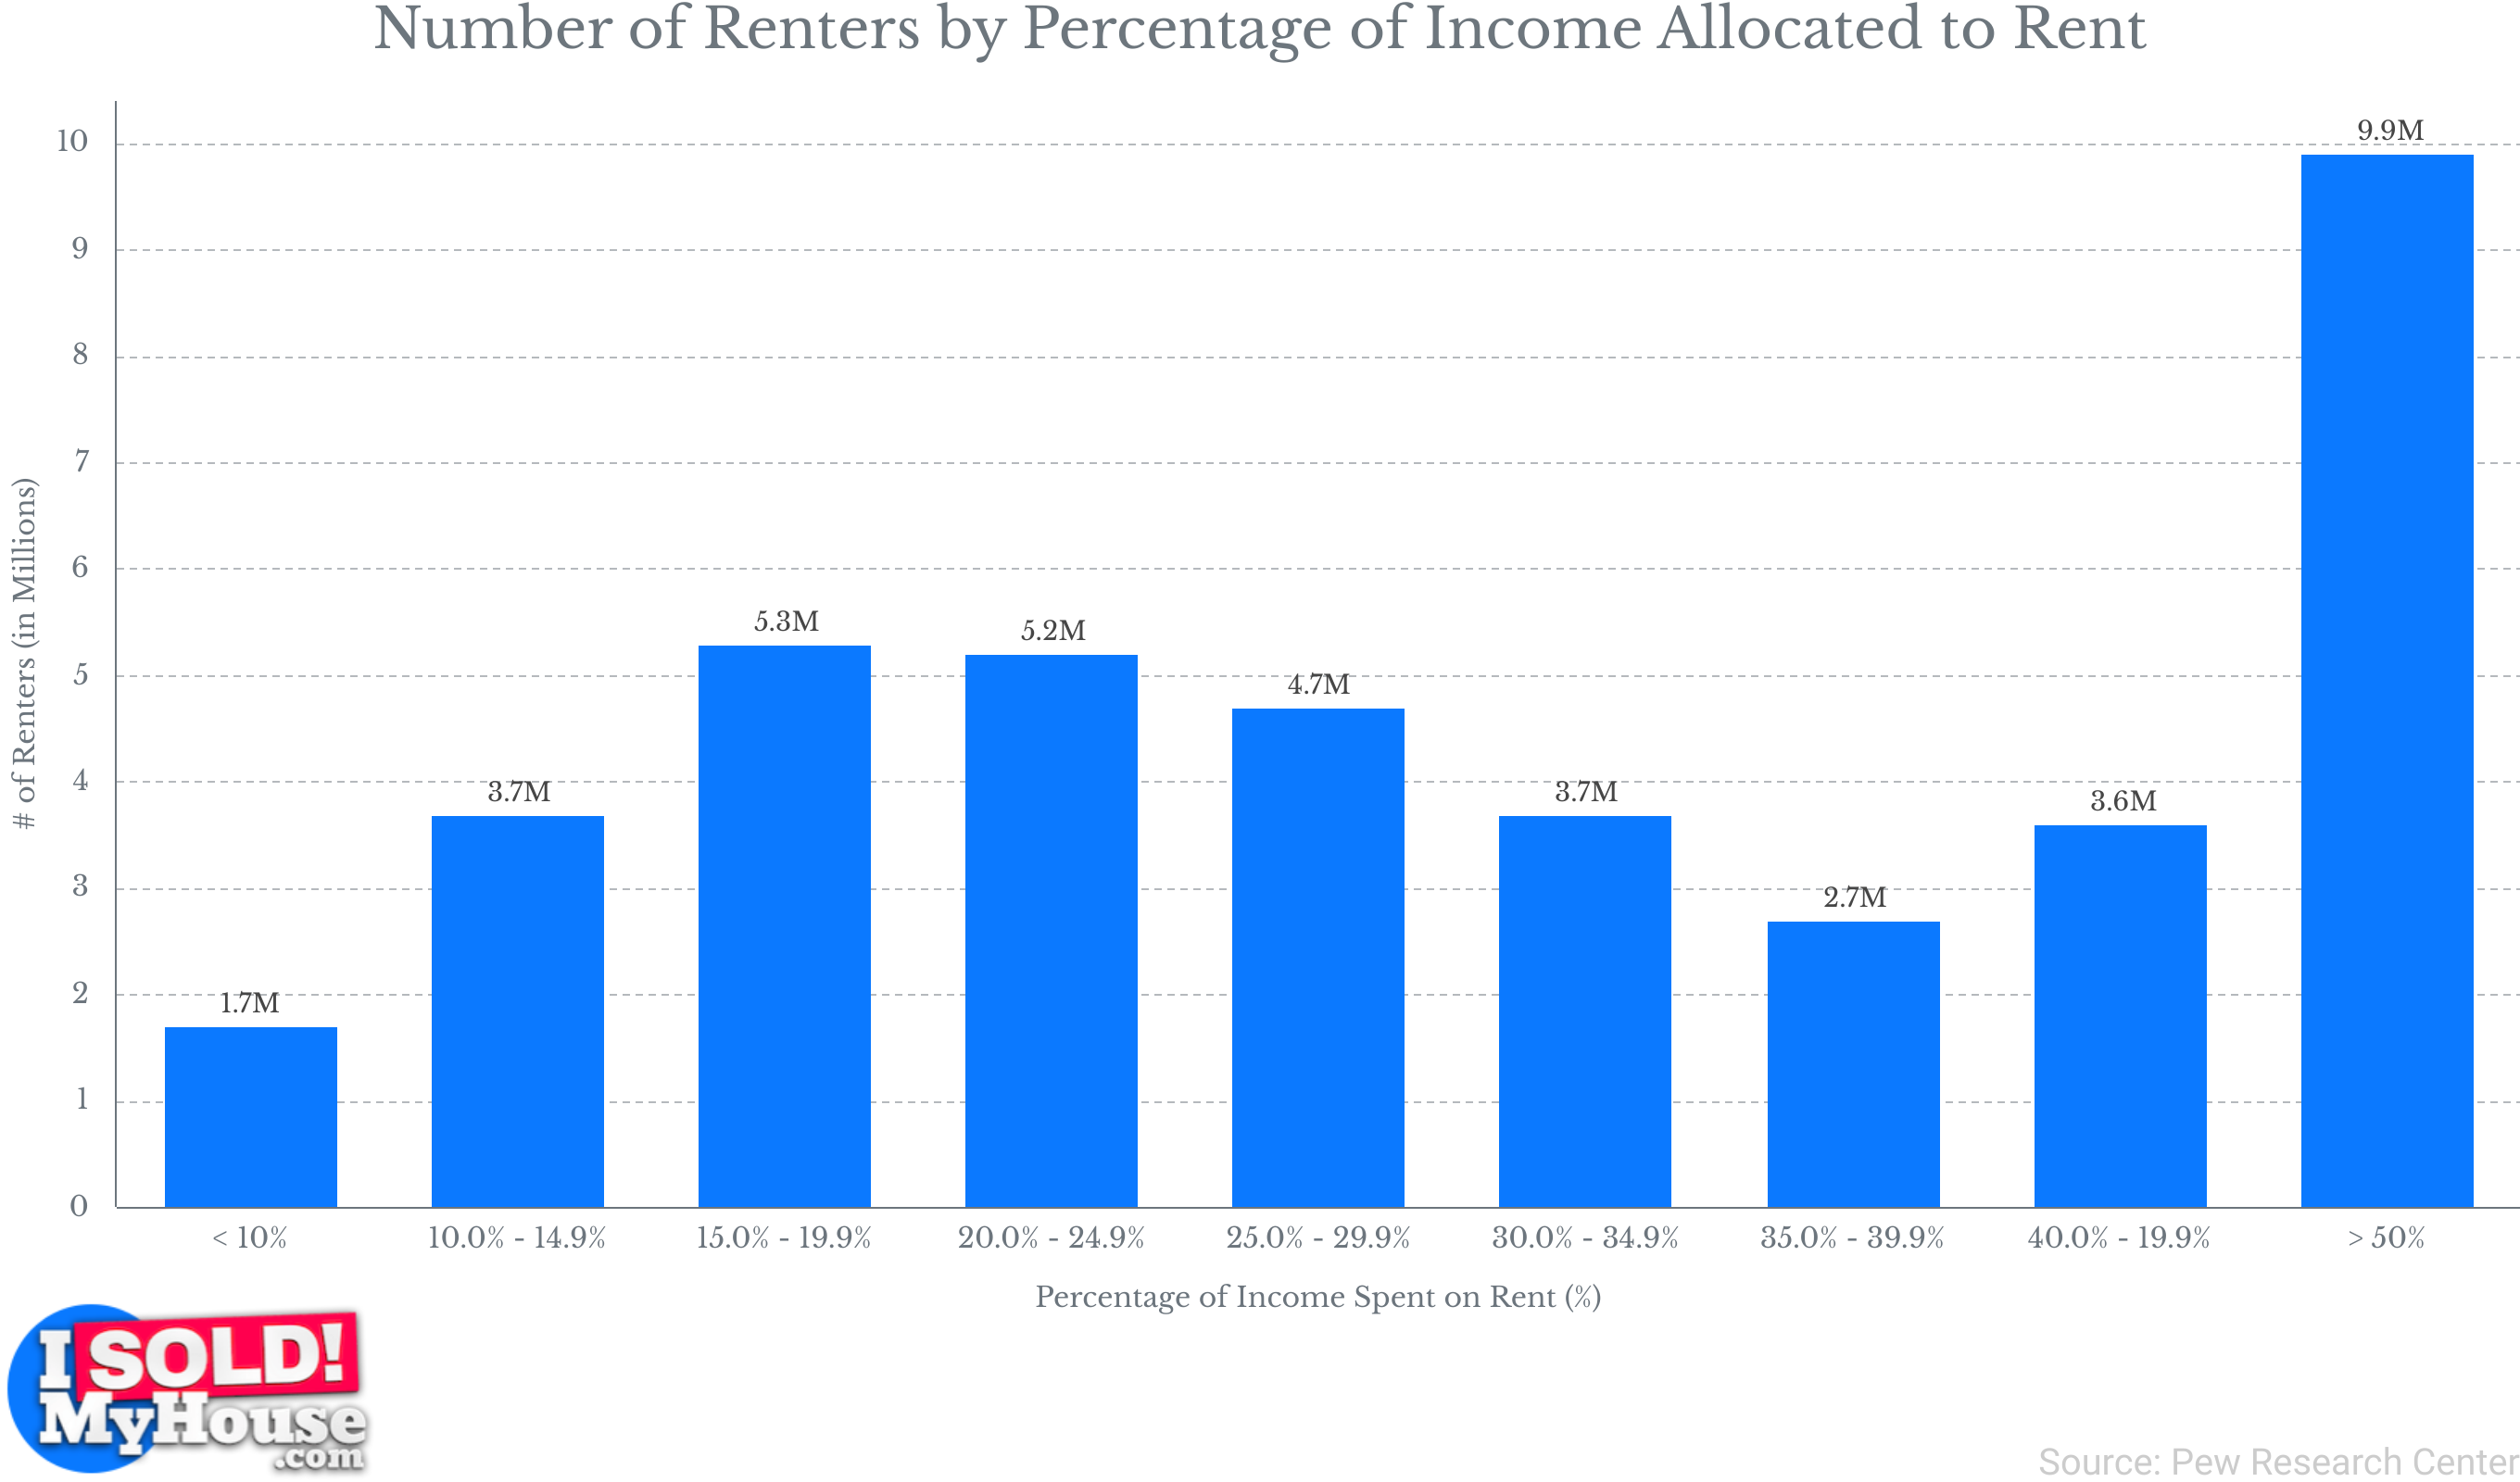
- The Department of Housing and Urban Development (HUD) defines individuals who allocate more than 30% of their income to housing as “cost-burdened,” and those who allocate over 50% as “severely cost-burdened.” In 2020, a notable 23% of renters found themselves spending at least 50% of their income on housing expenses. The heightened demand for rental units has intensified the challenge of locating affordable housing for renters. Simultaneously, the rate of rent increase has surpassed the growth in household income, compounding the affordability crisis.
- Approximately 38.9 million people, which accounts for 38% of renters, reside in apartment buildings consisting of five or more units. In contrast, around 41% of renters inhabit single-family residences, while an additional 5% live in mobile homes.
- In 2021, an estimated 14.3 million renters expressed intentions to relocate within the next 12 months. Among them, 39.3% planned to move to a different neighborhood within the same city, 29.1% intended to move to a different city, 15.2% had plans to move to a destination categorized as “somewhere else,” 13.1% aimed to relocate to a different residence but within the same neighborhood, and 3.3% did not specify their relocation plans.
Home Purchases and Neighborhood Sentiment
The residential real estate market is experiencing an unprecedented boom, with millions of investors making substantial purchases. However, the critical question arises: are these investments concentrated in desirable neighborhoods? Does this pattern differ between rental properties and owner-occupied ones? In this section, we scrutinize investor home acquisitions and assess the sentiments surrounding neighborhoods among both buyers and renters.
- In 2023, the residential real estate market is estimated to be valued at $2.53 trillion. It is projected to exhibit a compound annual growth rate (CAGR) of 2.04%, with the market expected to reach $2.80 trillion by 2028.
- In the fourth quarter of 2021, investors acquired a historic portion, accounting for 18.4% of the available housing inventory. This figure translates to approximately 80,000 properties, collectively valued at an impressive $50 billion.
- In the third quarter of 2022, there was a notable year-over-year decline in investor home purchases, amounting to a substantial 30.2%. Investors acquired approximately 17.5% of all home purchases, which translates to approximately 65,000 properties. This decline in investor activity can be attributed to a combination of factors, including inflation, increasing interest rates, and concerns about a looming economic recession.
- In 2021, 92.7% of homeowners agreed that their neighborhood had good schools. In comparison, renters who expressed satisfaction with the schools in their rental neighborhood amounted to 89.3%.
- In 2021, approximately 26.2% of renters expressed concerns about a high incidence of petty crime in their neighborhood. In contrast, homeowners who shared the same sentiment accounted for only 13.3%.
- In 2021, just 36.5% of homeowners expressed satisfaction with the quality of public transportation services in their neighborhoods. In contrast, approximately 61% of renters reported that they believed their neighborhoods offered good public transportation services.
Affordability
In recent years, the long-standing assumption that renting is invariably the more affordable choice has been called into question due to various factors. Escalating property prices in numerous regions have made homeownership a daunting prospect for many individuals and families.
Simultaneously, rental costs have also surged, especially in highly desirable metropolitan areas. This blurred affordability gap carries a dual impact. For renters, it often translates into an elusive dream of saving for a down payment to transition into homeownership, as their incomes are stretched thin by high rents.
Conversely, prospective homebuyers grapple with the challenge of accumulating sufficient savings to afford a home in an increasingly costly market. In this section, we aim to shed light on the realities faced by both segments of the housing market.
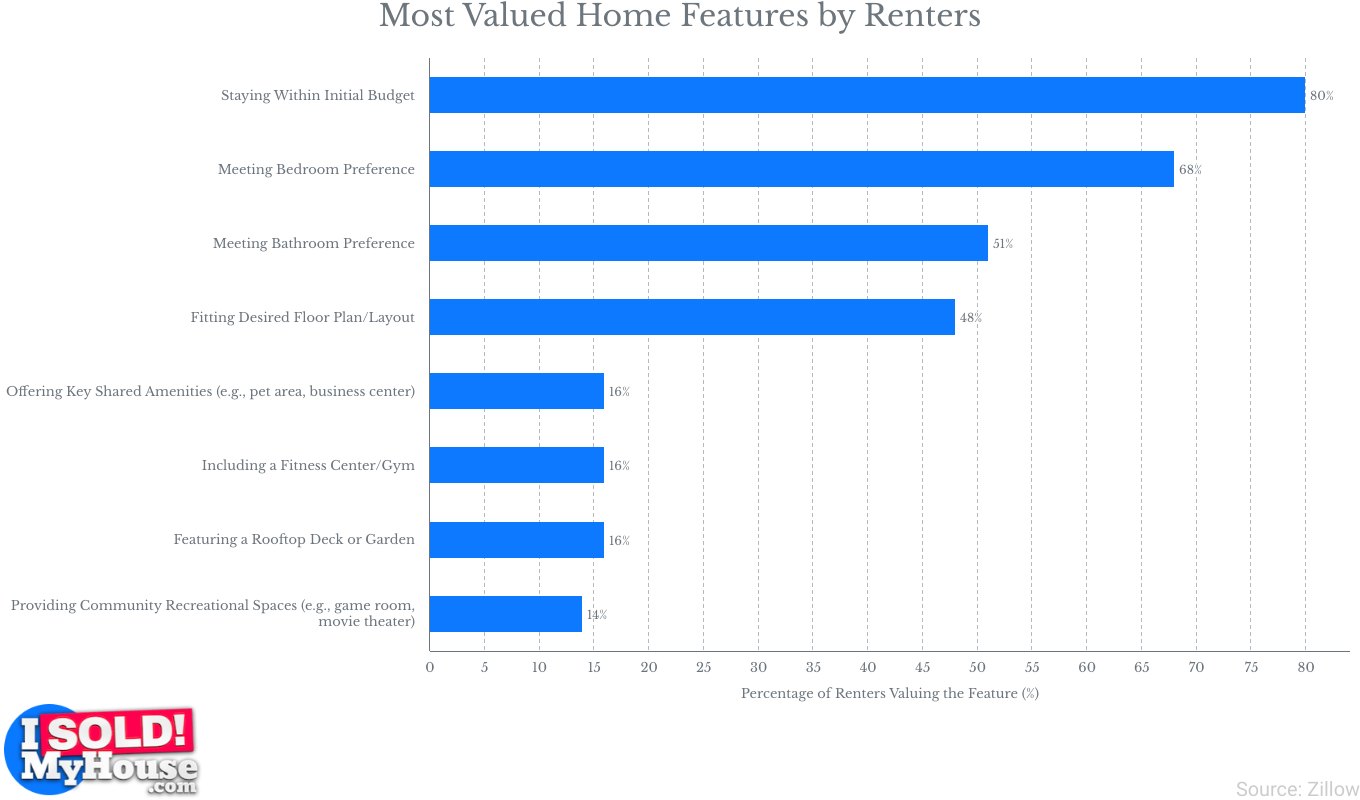
- In 2022, a significant 80% of renters indicated that the affordability of a property was the most crucial home characteristic they considered. Following closely, the preference for the number of bedrooms ranked second, with 68% of respondents valuing this feature and the preferred number of bathrooms coming in at third with 51% of renters preferring this feature.
- As of 2023, renting an average three-bedroom home is more cost-effective than owning a single-family home in counties with populations of at least 1 million. Remarkably, Cook County, IL stands as the sole exception among counties with populations exceeding 1 million, where buying is more affordable than renting.
- In 2022, the average value of owner-occupied single-family properties stood at $413,988, while for rental properties, it averaged $365,313. Consequently, the average property value for single-family investment properties was lower than that of owner-occupied homes.
- In the second quarter of 2023, the median price for a starter home at both the national and regional levels is $342,200. The qualifying income required to afford a starter home is $96,576, whereas the median income of prime first-time homebuyers stands at $59,326.
- Conversely, in 2020, both at the national and regional levels, the median price for a starter home was $255,200. During that year, the qualifying income for a starter home was $49,008, while the median income of prime first-time homebuyers was $54,856.
- In the second quarter of 2023, the average monthly net effective rent exhibited a year-over-year increase of 2.6%. This growth rate aligns closely with the pre-pandemic five-year average of 2.7%, though it is notably lower than the record-high increase of 15.2% observed in the first quarter of 2022.
- In the second quarter of 2023, the Northeast/Mid-Atlantic region experienced the most significant year-over-year rent growth, with Newark leading at 5.6%, followed by Providence at 5.3%, and Hartford at 5.2%. The Midwest ranked second with rent growth at 4.3%, trailed by the Southeast (2.0%), South-Central (1.7%), Pacific (1.4%), and the Mountain West (-0.9%).
- The national median sale price for a single-family home experienced a significant surge, increasing by 25% from $327,100 in the fourth quarter of 2019 to $408,100 in the fourth quarter of 2021. Notably, the most substantial price increases were observed in the West, Midwest, and Northeast regions.
- Between 1999 and 2022, rental rates experienced a cumulative growth of 135%, whereas income saw a cumulative increase of 77% over the same period.
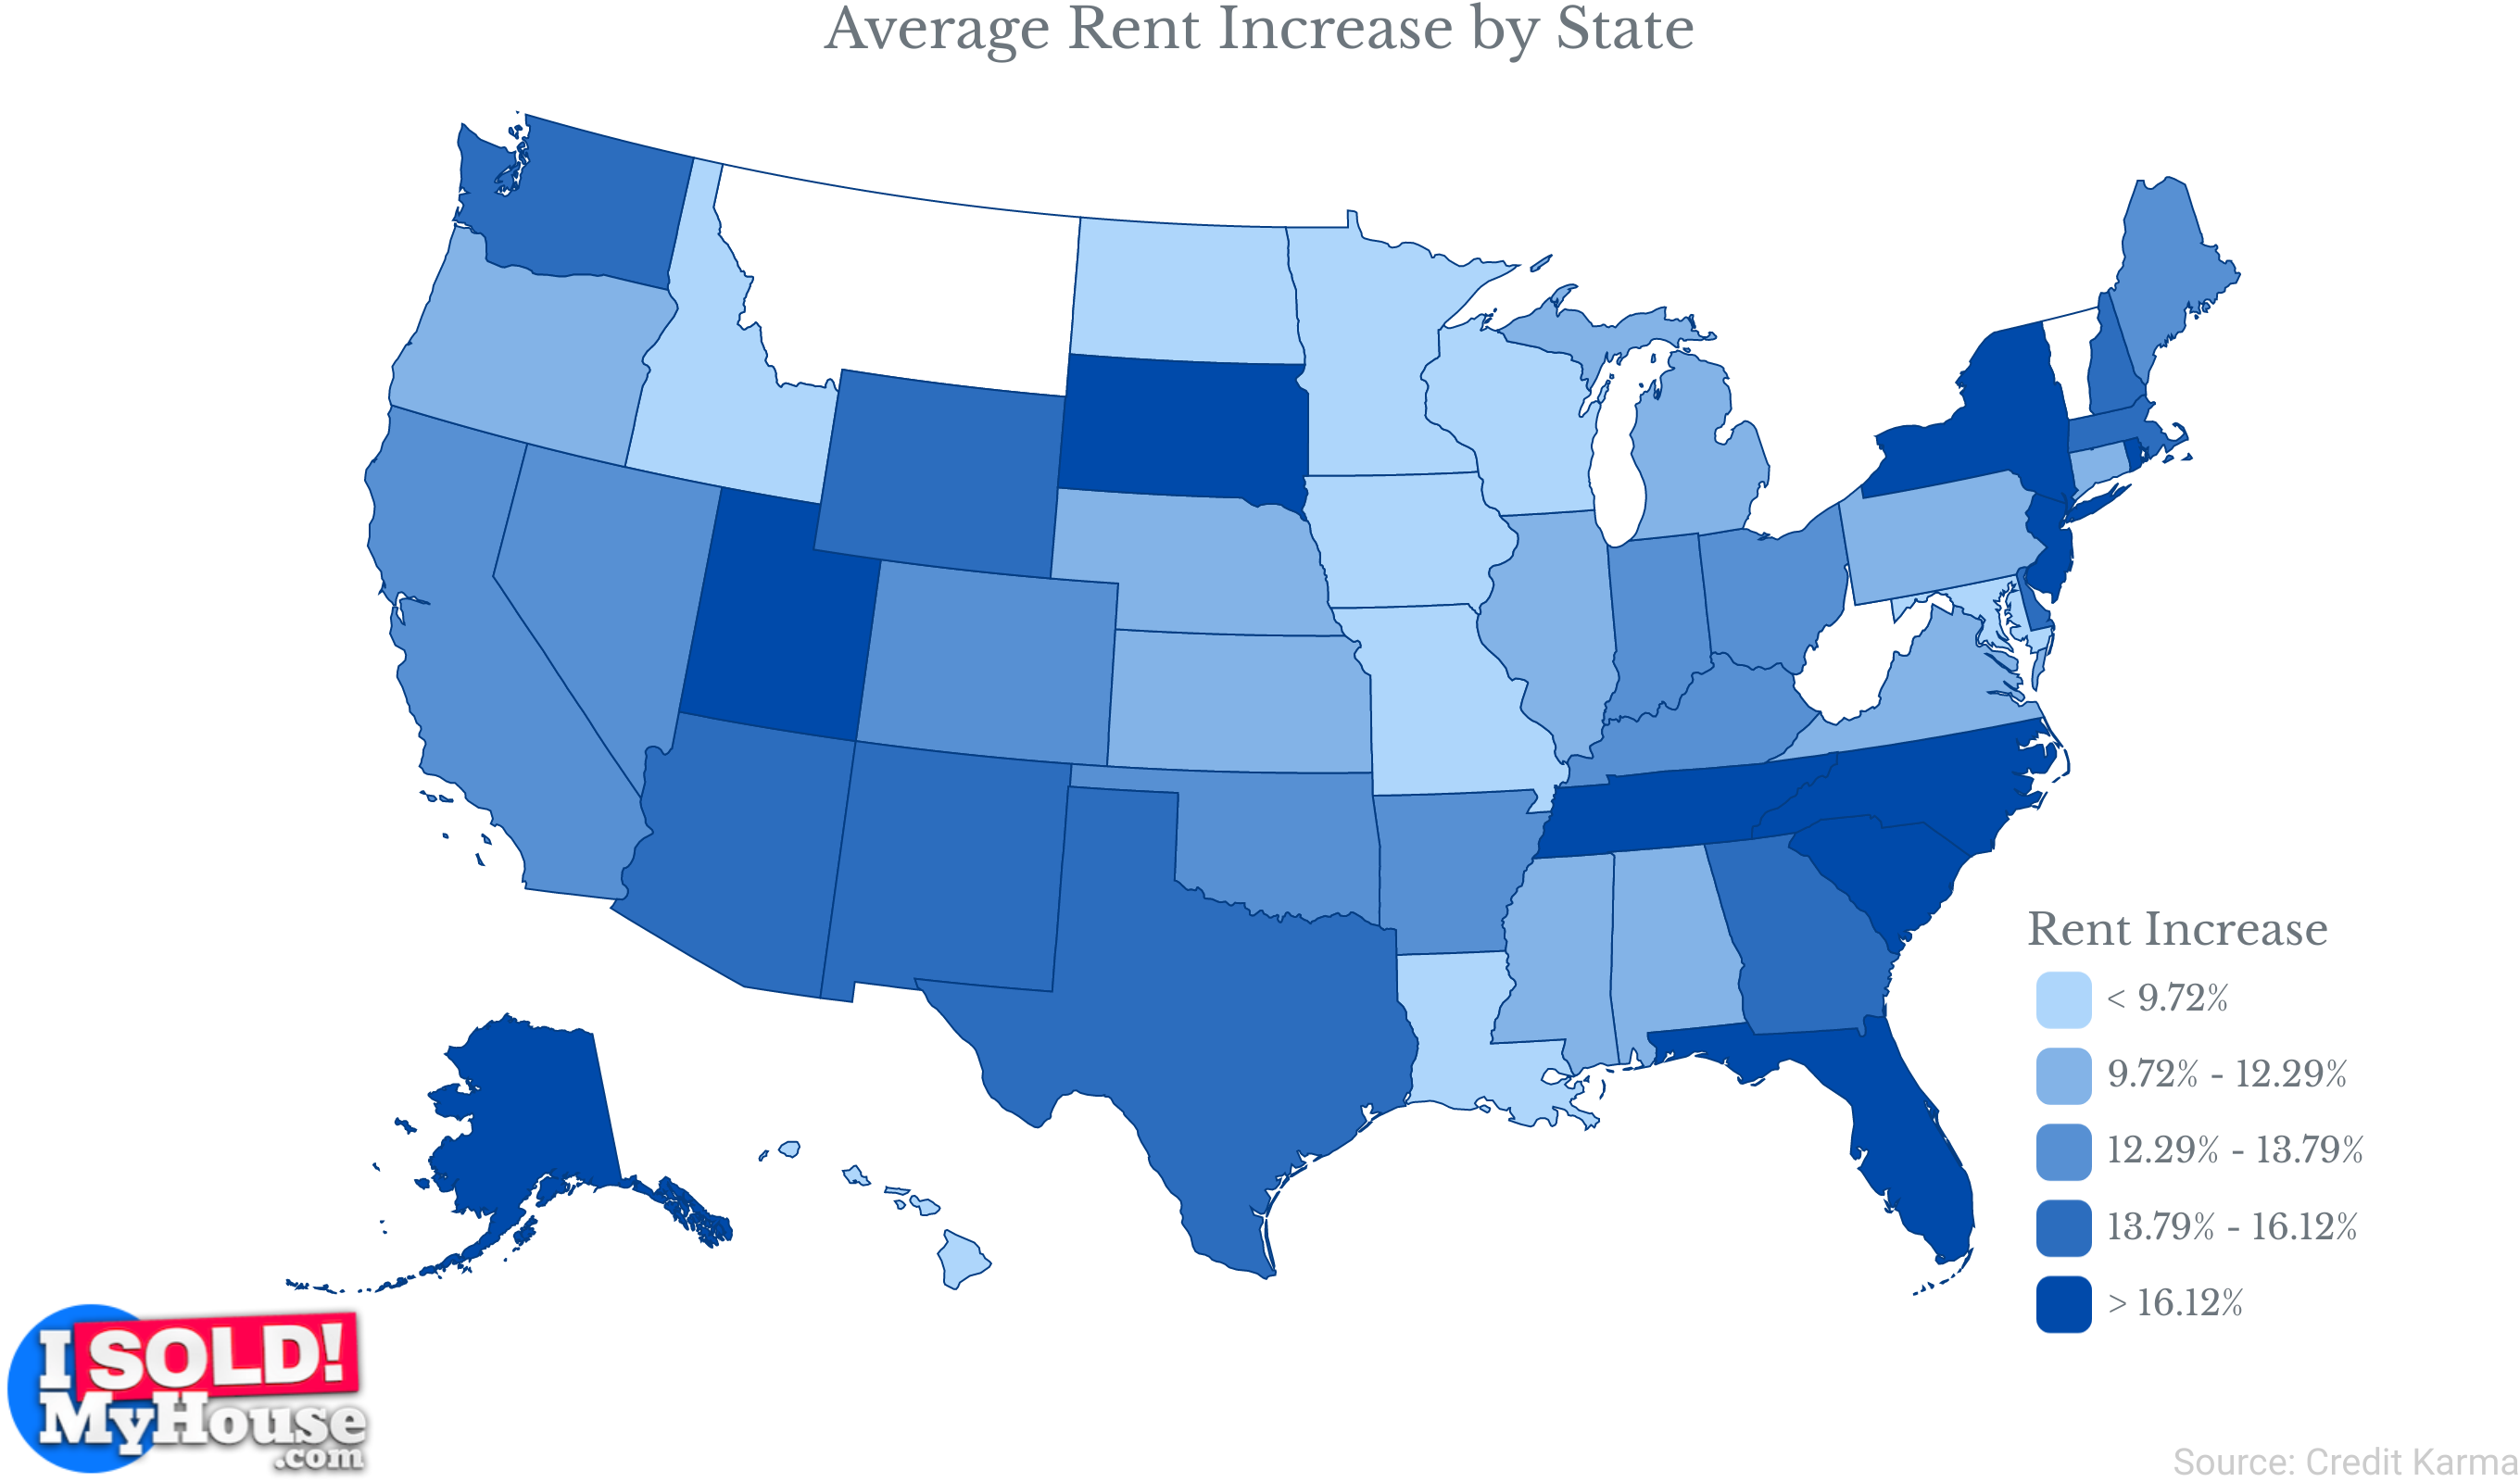
- Between 2017 and 2022, renters across the United States experienced an average rent increase of 18%. This rise in rent outpaced inflation in all regions except the Northeast. Specifically, rent increased by 21% in the West, 20% in the South, and 18% in the Midwest. In contrast, the Northeast saw a more modest increase in rents, with a 12% growth during the same period.
- As of 2023, the total rent debt in the United States has exceeded $10.4 billion, impacting 5.1 million households who are behind on their rent payments. This staggering figure underscores the ongoing crisis of rent debt, persisting beyond the pandemic and putting millions of renters at risk of eviction.
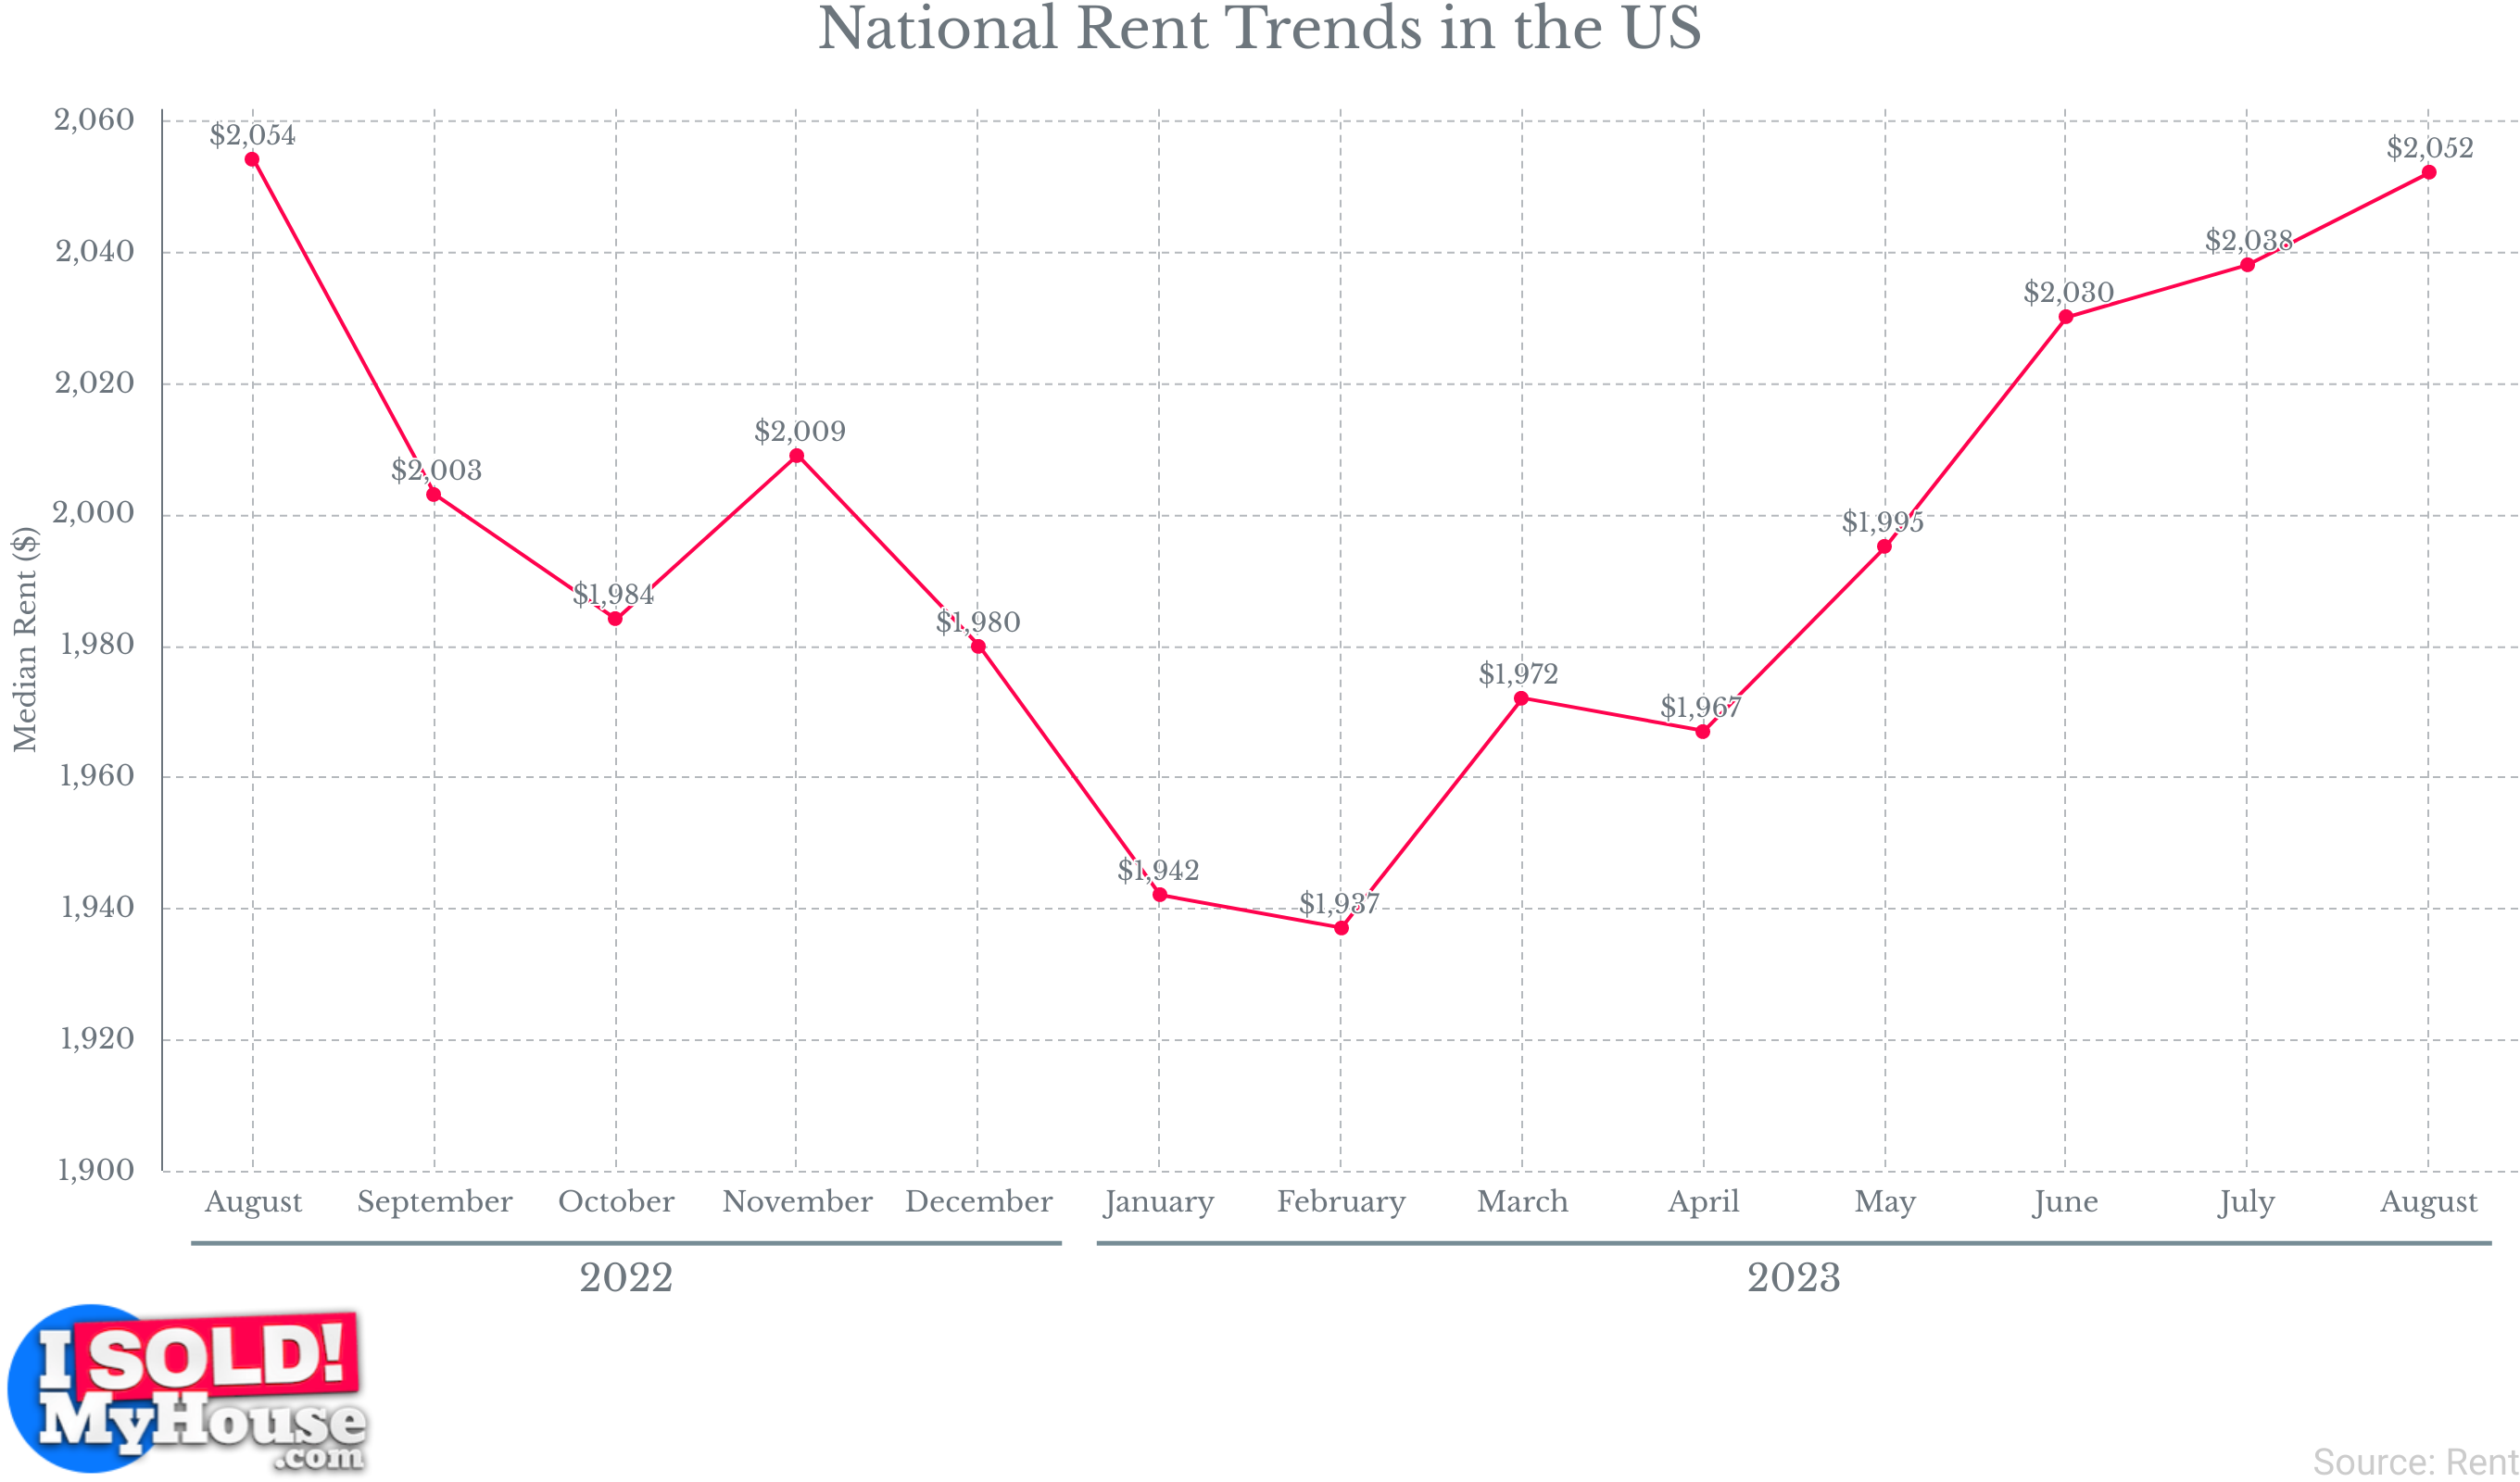
- As of 2023, the national median rent price stands at $2,052. This figure reflects a 0.71% increase, with monthly growth accelerating in August. This rise is an improvement from the 0.31% increase observed in July but still falls below the average monthly increase of 0.97% recorded since February when prices hit their lowest point at $1,937.
- In 2021, the median monthly total housing cost, inclusive of utilities, for homeowners amounted to $1,200. For renters, this figure was $1,184 in the same year.
Vacancy Rate
Comprehending vacancy rates is essential for evaluating the well-being of both the homeownership and rental markets. Vacancy rates function as a critical indicator, providing valuable insights into housing unit availability, resident mobility, and the overall stability of communities.
By delving into the variations and shared patterns in vacancy rates among homeowners and renters, we gain profound insights into the intricate housing environments and the factors shaping individuals’ housing preferences.
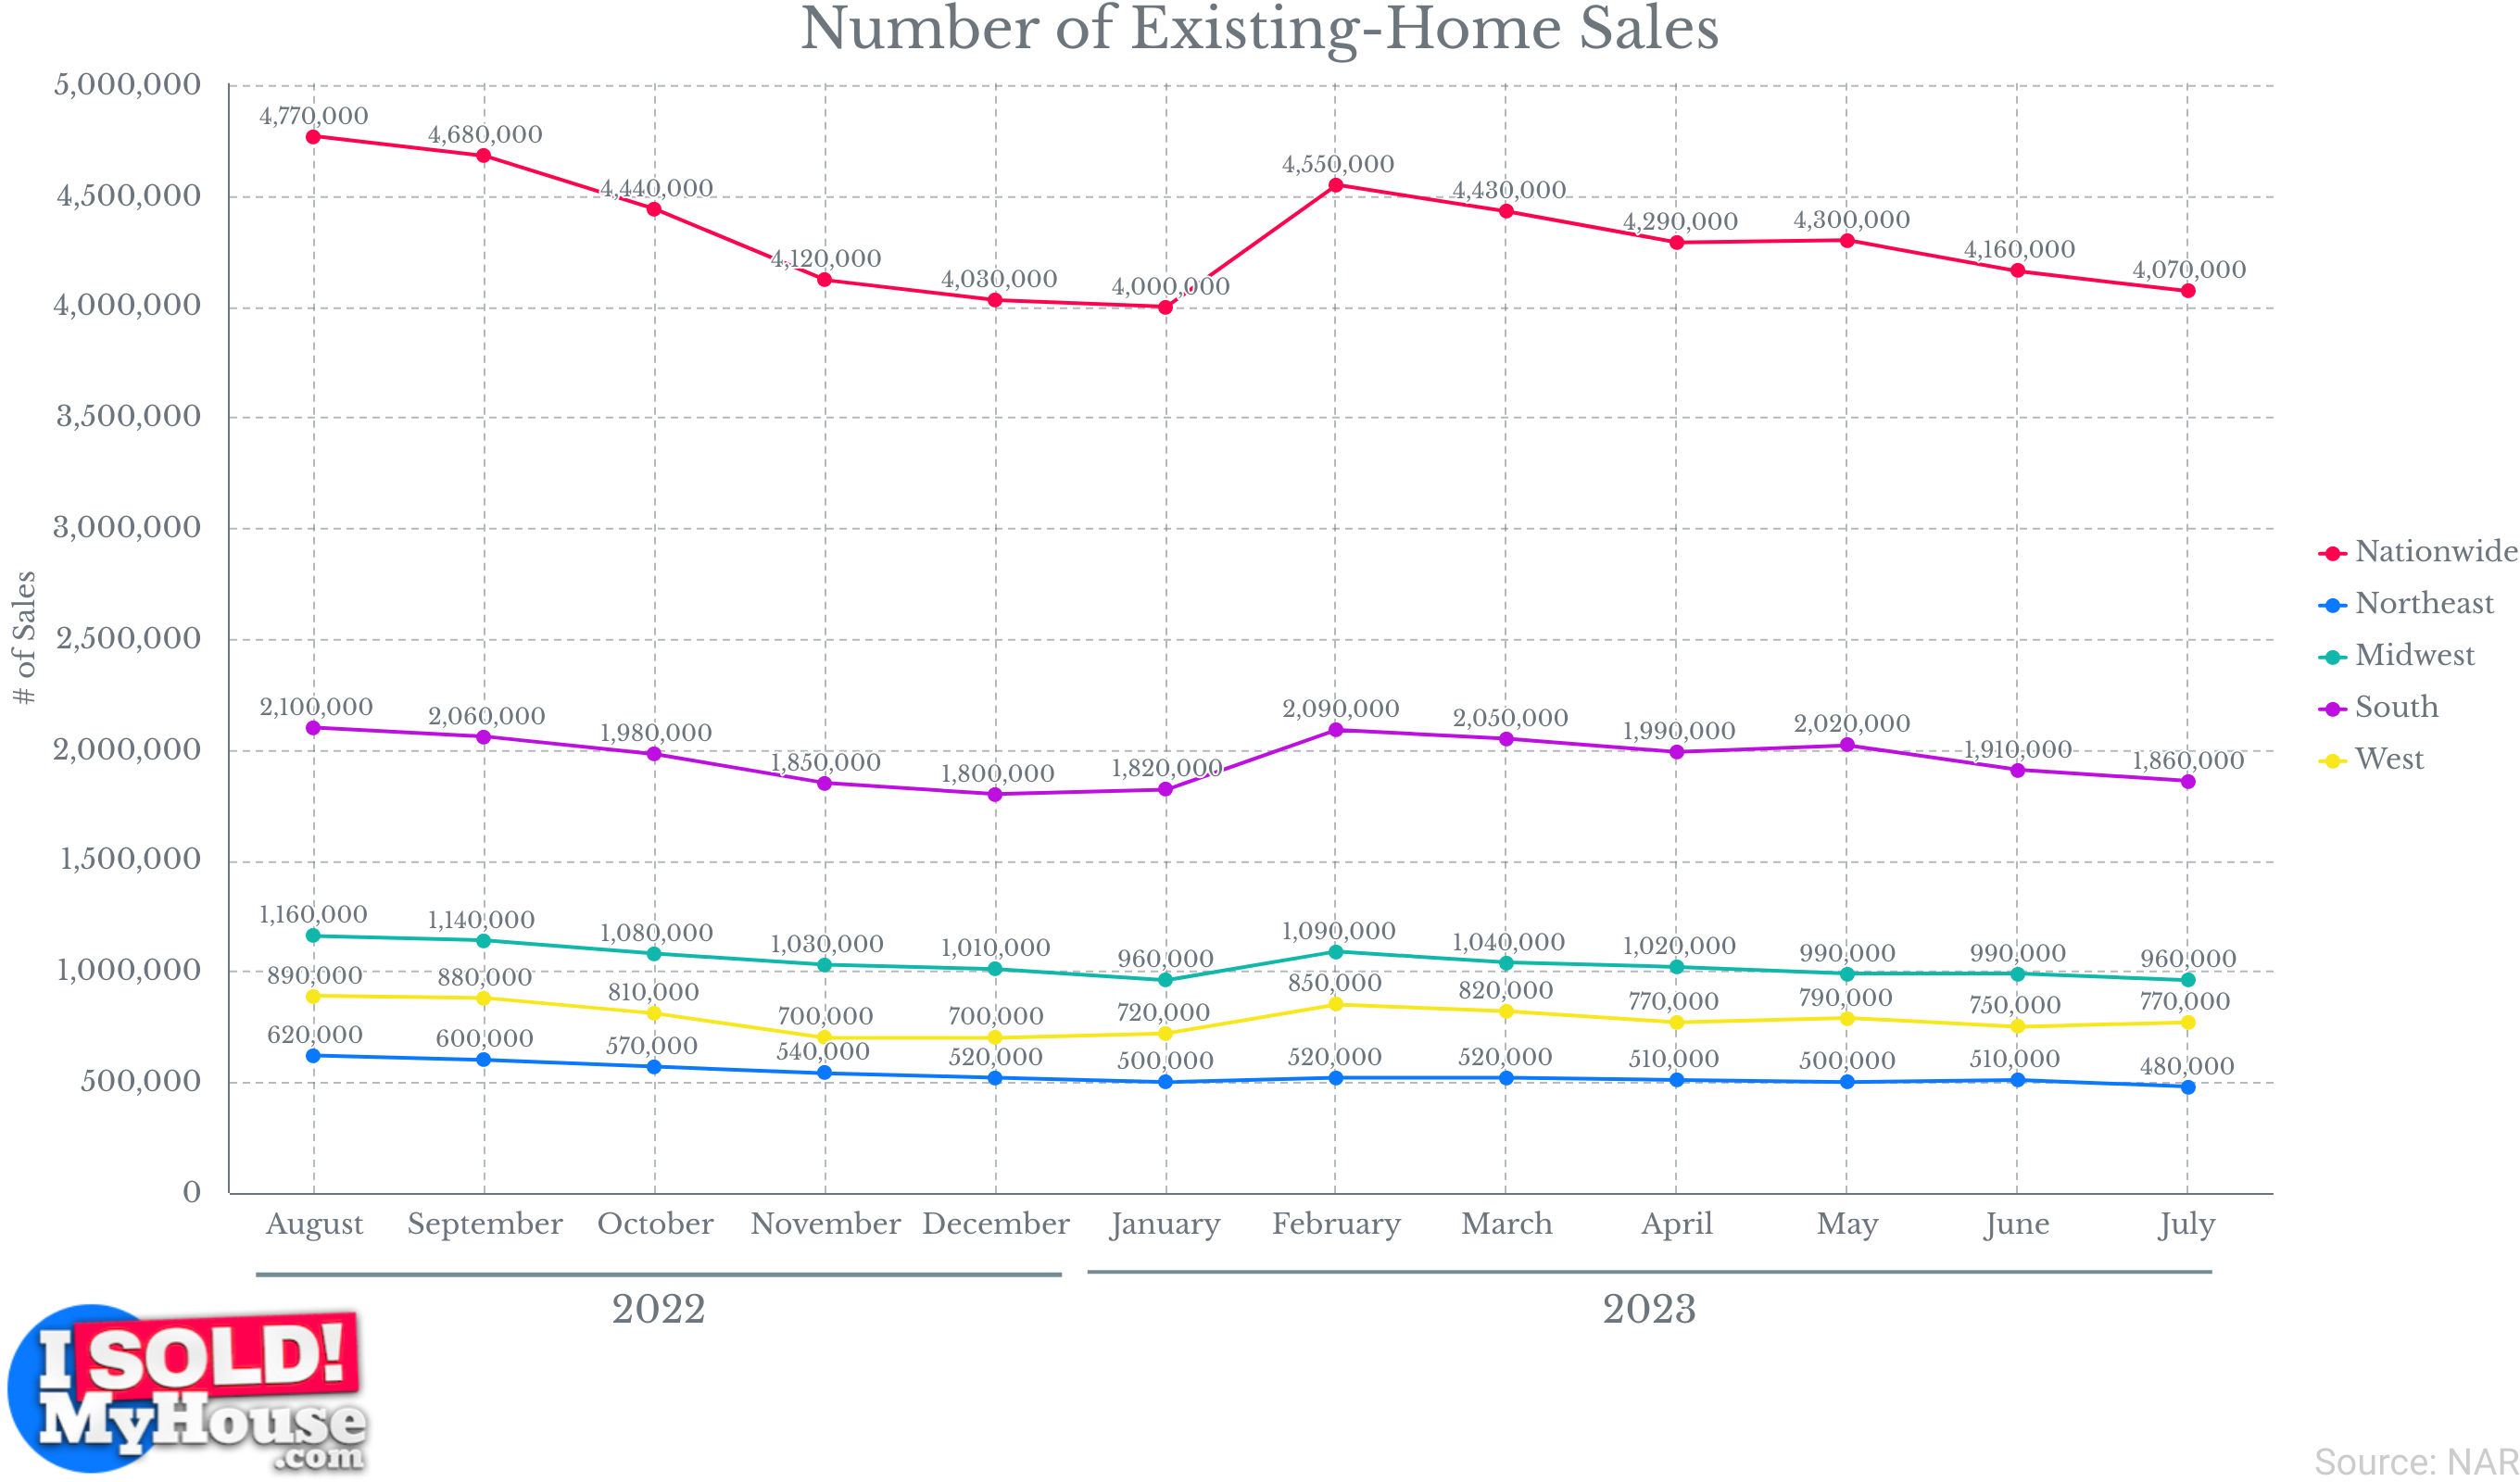
- In July 2023, existing-home sales declined to a seasonally adjusted annual rate of 4.07 million, reflecting a decrease of 2.2%. Among the four major U.S. regions, year-over-year sales decreased in the Northeast, Midwest, and South.
- In the second quarter of 2023, the national vacancy rate for homeowner housing was 0.7%. This is lower than the rate in the second quarter of 2022, which was 0.8%.
- The national vacancy rate for rental housing in the second quarter of 2023 stood at 6.3%, representing an increase compared to the rate in the second quarter of 2022, which was 5.6%.
- In the second quarter of 2023, the national homeownership rate stands at 65.9%. This rate remained consistent in comparison to the second quarter of 2022 (65.8%) and the first quarter of 2023 (66.0%).
- In the first quarter of 2023, the vacancy rate for rental apartments was approximately 6.4%, representing an increase from the 4% vacancy rate reported in Q3 2021.
- In a typical year, approximately 41% of properties may encounter vacancies due to various reasons, including evictions, tenants terminating their leases prematurely, or tenants departing at the end of their lease agreements.
Homeowners vs Renters: Demographic Breakdown
Analyzing factors such as age, race, gender, and income enables us to construct a comprehensive portrait of the individuals and families comprising the homeowner and renter communities. This approach illuminates the intricate socioeconomic factors at play, offering a nuanced perspective on the ever-evolving housing dynamics.
By age
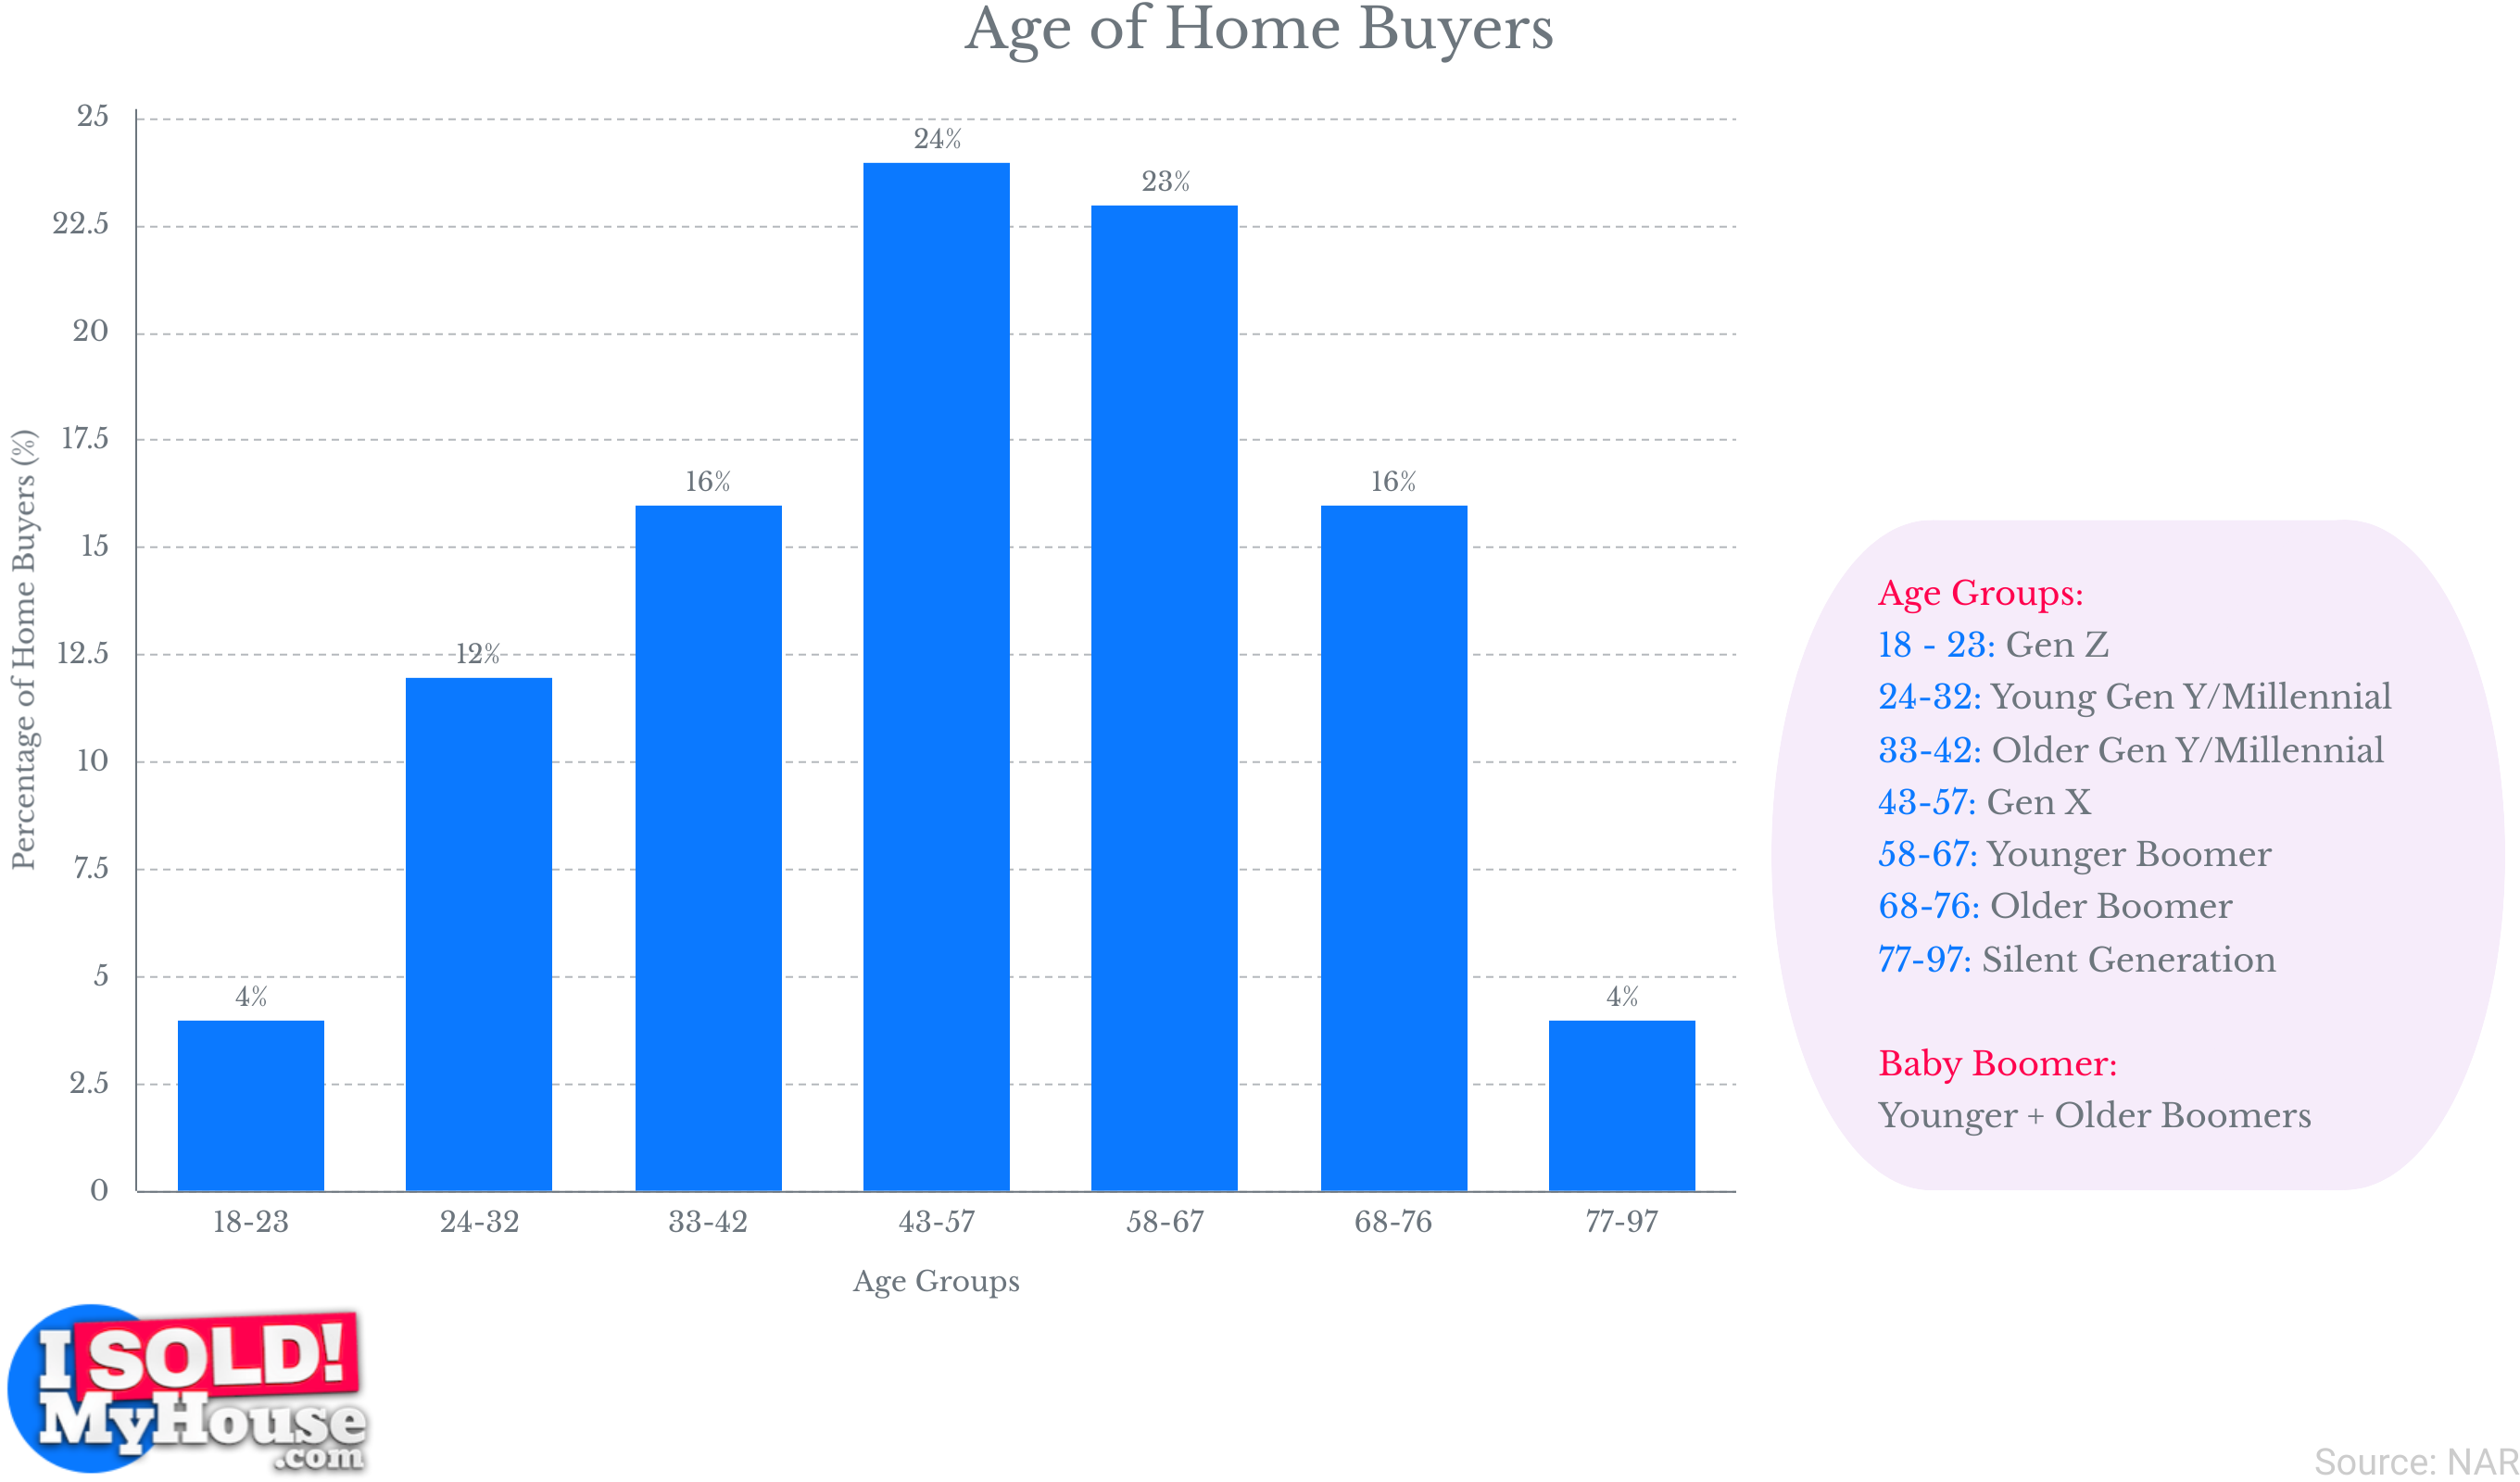
- In the context of home buyers, Baby Boomers comprised the largest share, accounting for 39% of the total.
- In 2022, Gen Xers boasted the highest household incomes among all generations, with a median income of $114,300. They were followed by Millennials, whose median income stood at $102,900.
- In 2022, 48% of renters were aged under 30, while only 10% of renters were 65 years or older.
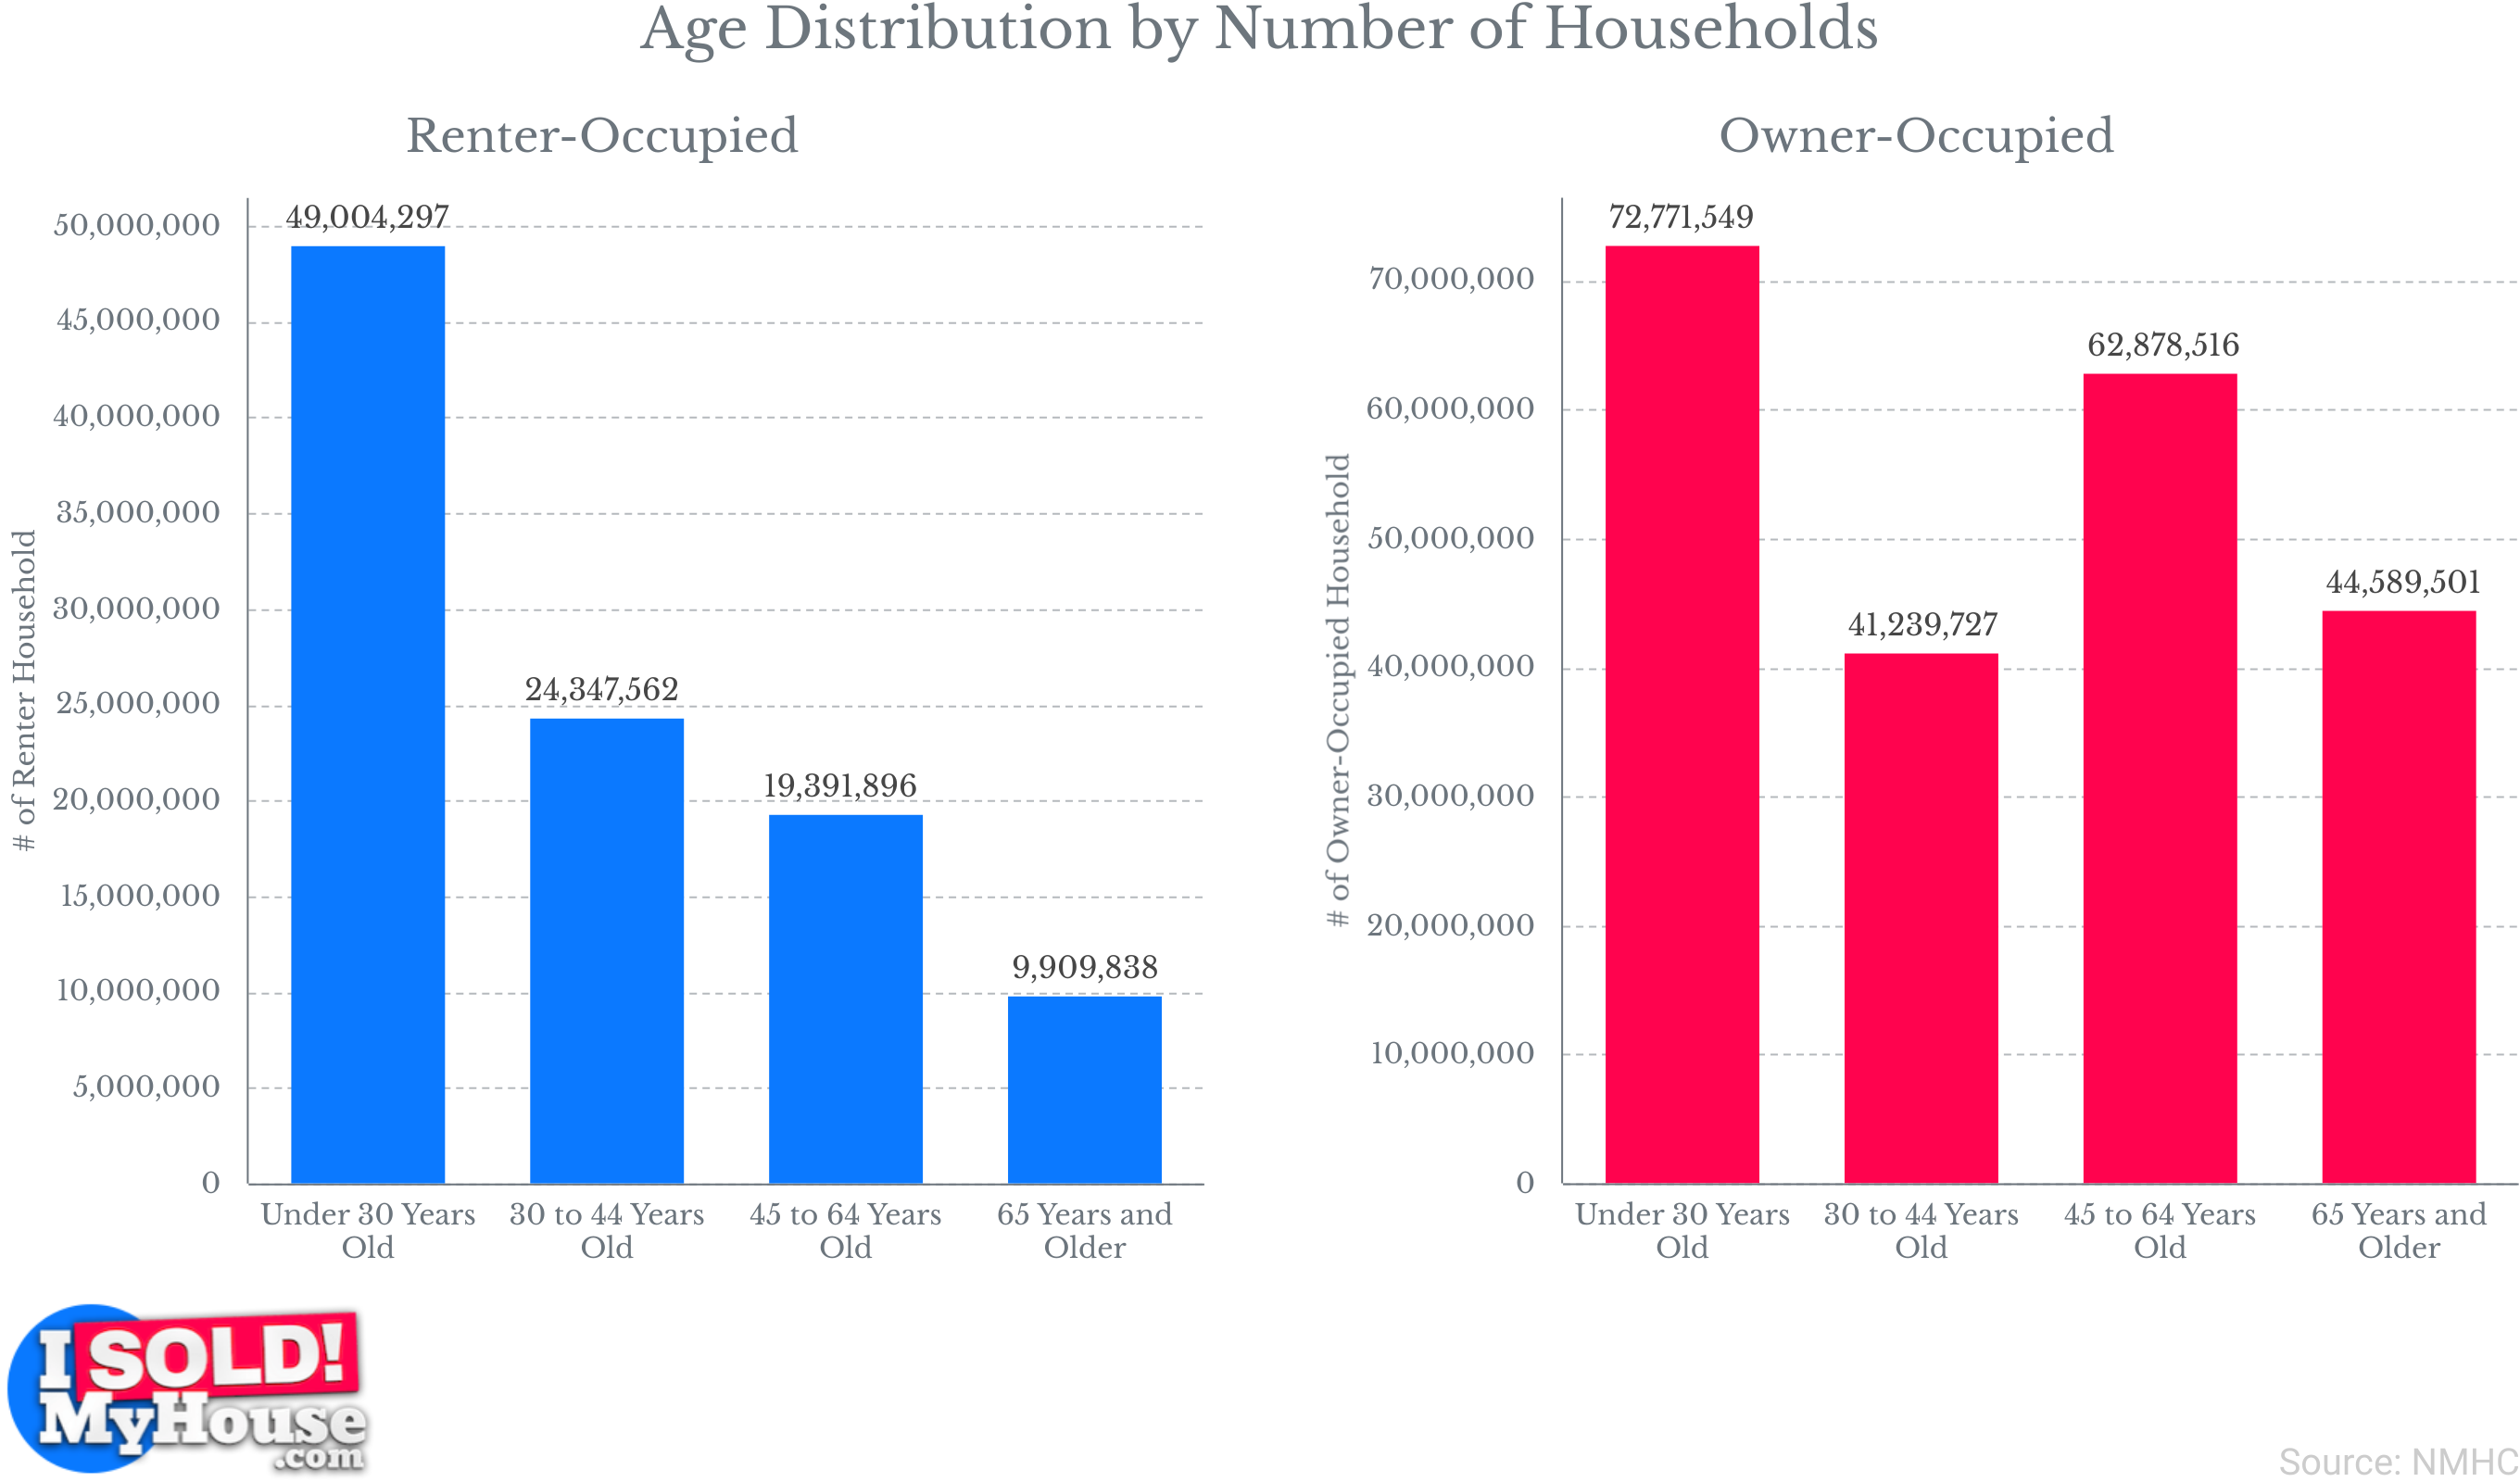
- Between 2021 and 2022, around 79.5% of Americans aged 65 or older were homeowners. In the same timeframe, 39% of Americans aged 35 years and under owned their homes.
- The median age of renters is 39 years old. Remarkably, only around 7% of renters are in their 70s.
- The largest demographic group among renters is Millennials, comprising 42% of the total.
- In 2022, around 24.7% of Millennials anticipate always renting their homes. This figure marks a substantial increase from 13.3% in 2018.
- By the year 2040, the homeownership rate for every age group is projected to decline to 62%.
By Race and Gender
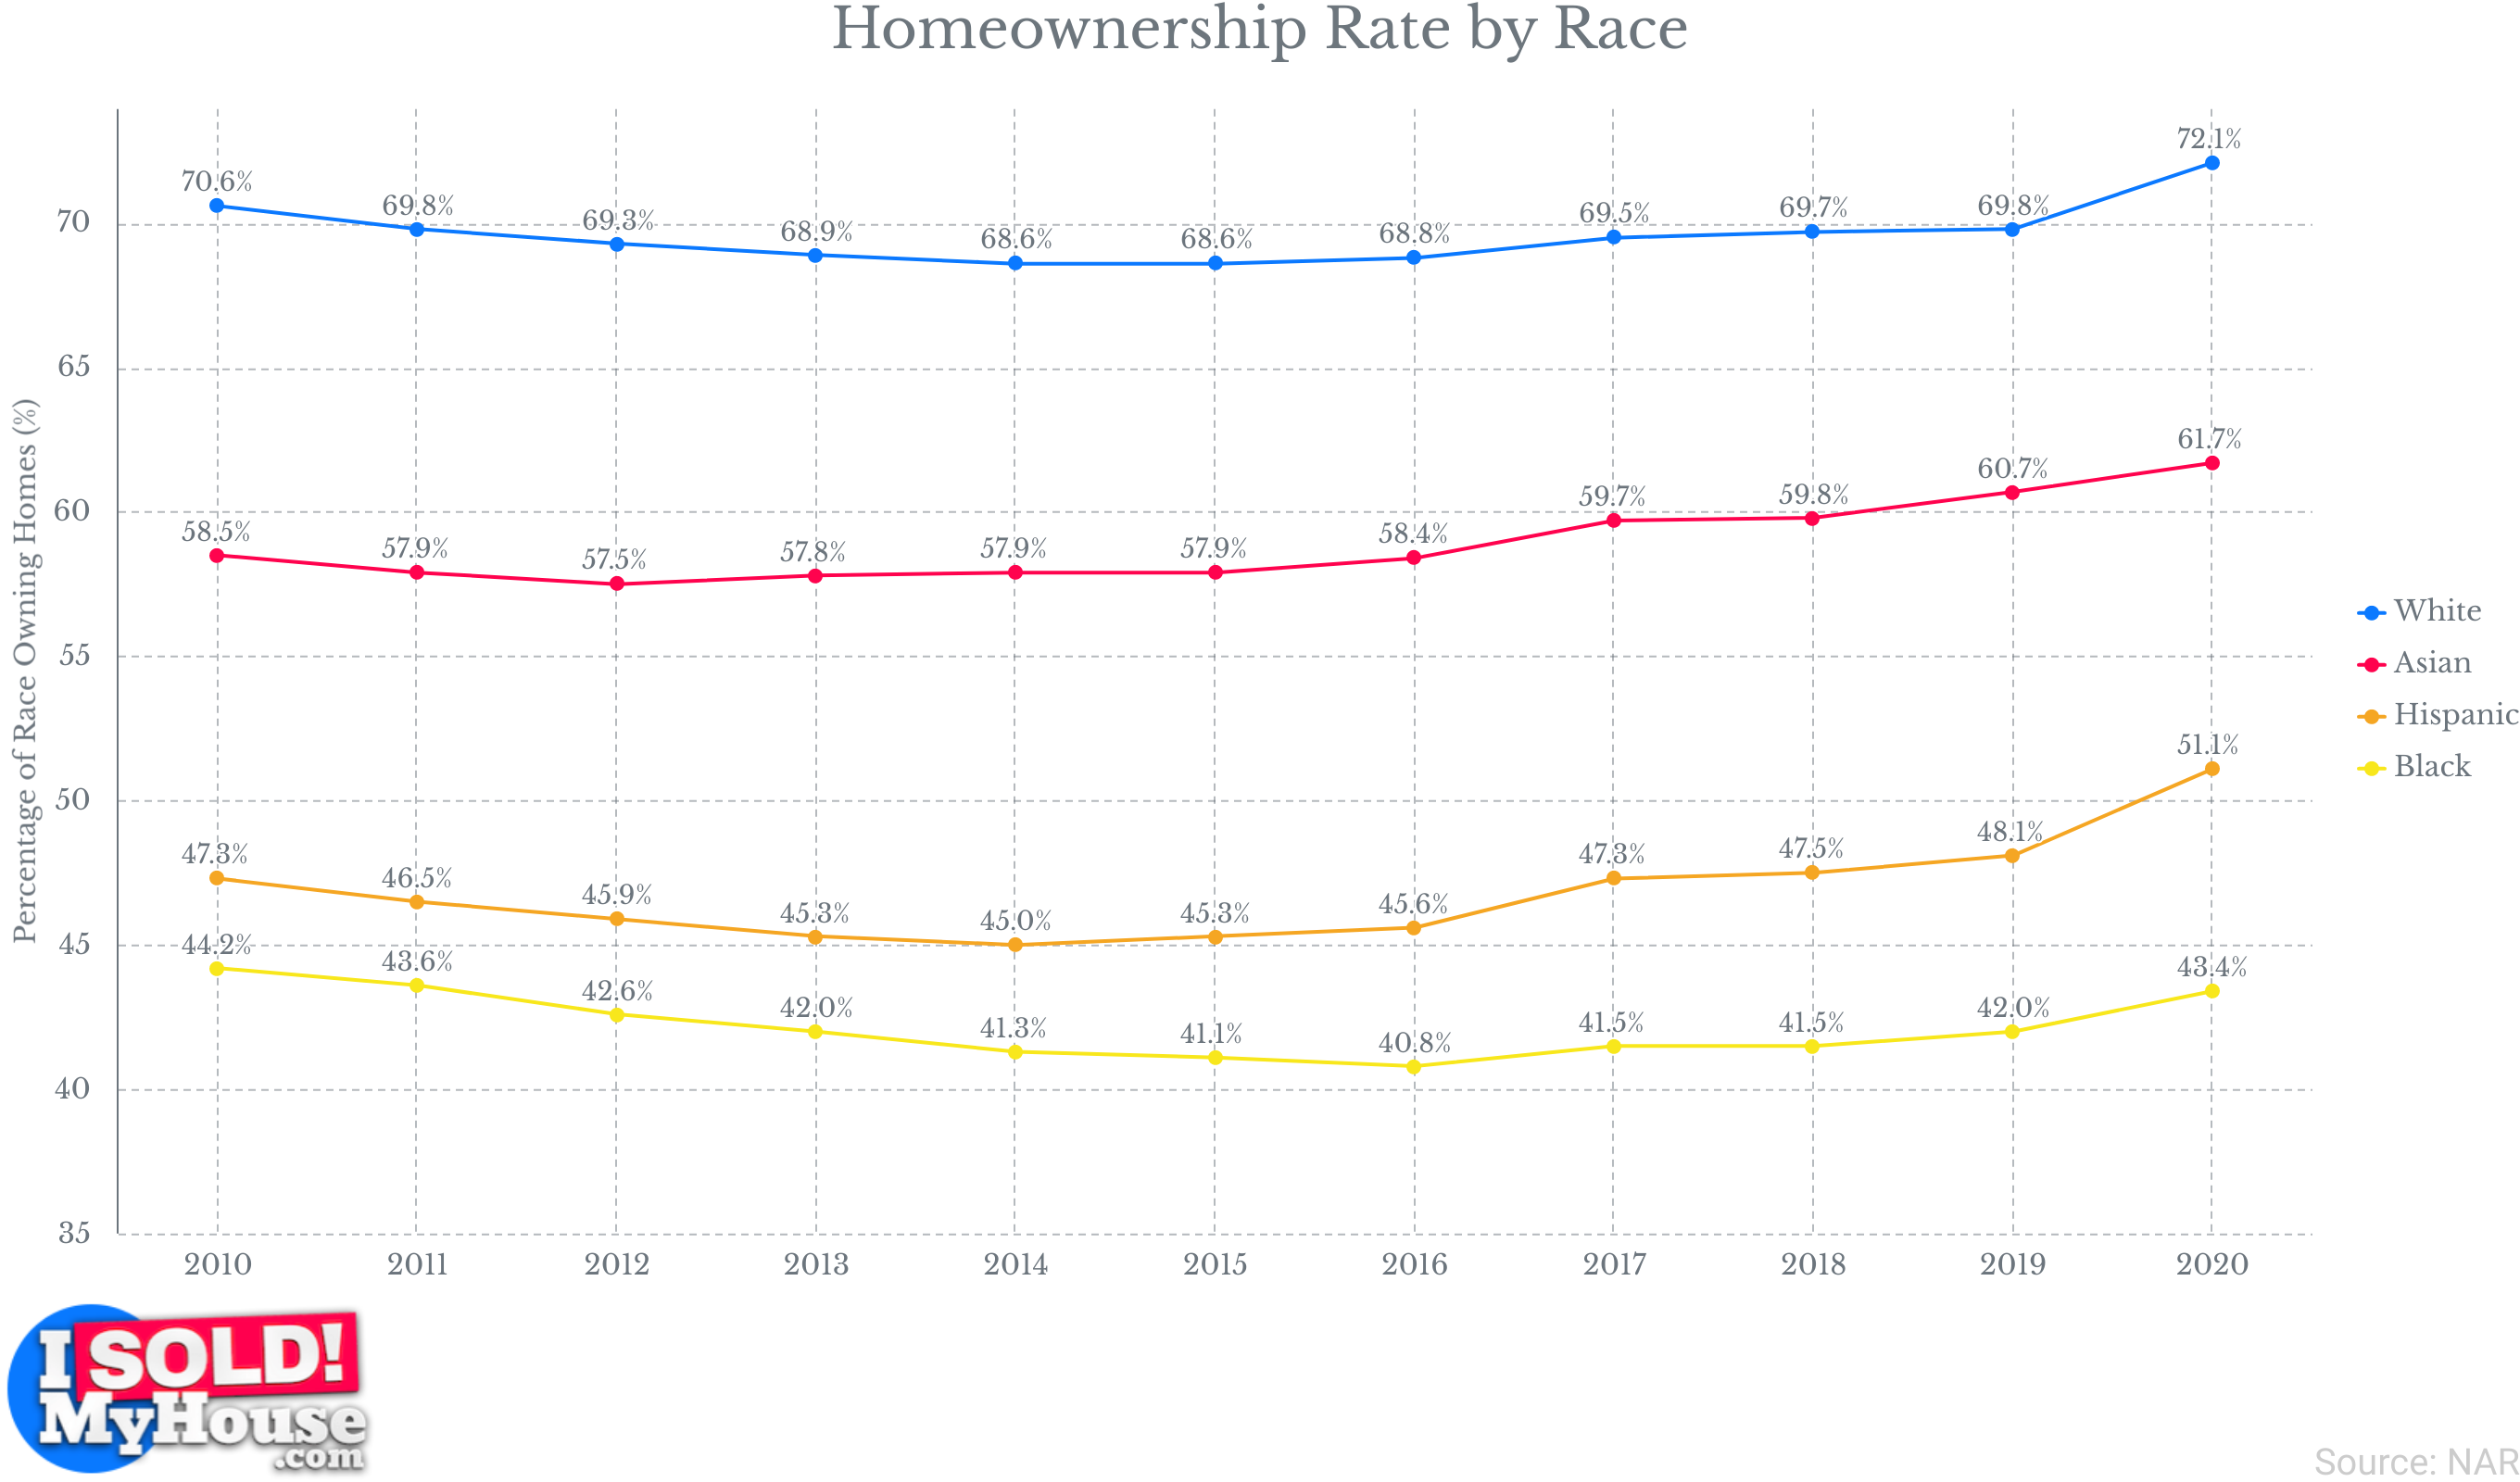
- In 2020, homeownership rates in the United States varied across different racial and ethnic groups. White households had the highest homeownership rate, with 72.1% owning homes. Asian households followed with a homeownership rate of 61.7%, Hispanic households had a homeownership rate of 51.1%, and Black households had a homeownership rate of 43.4%.
- Minorities constituted 81% of the 3.9 million increase in the number of renter households between 2001 and 2010. Within this growth, Hispanic renters represented 39%, while Black renters accounted for 27%.
- In 2023, Asian and Hispanic homeowners in the United States saw the most significant gains in homeownership rates. These rates increased by 5 percentage points and 4 percentage points, respectively.
- Approximately 30% of Black renter households are classified as ‘severely cost-burdened,’ which means they allocate over 50% of their income toward rent. This figure, totaling 2.5 million households, is the highest among all racial groups.
- In 2023, 20% of Black and 15% of Hispanic loan applicants faced mortgage denials, highlighting the fact that Black and Hispanic home buyers experienced the highest denial rates for both purchase and refinance loans. In contrast, only 11% of White and 10% of Asian applicants encountered denials during the same period.
- By the year 2040, the number of elderly Black renters is projected to rise to 2.6 million, a significant increase from the 1.3 million recorded in 2020. This projection assumes that current policies remain unchanged, potentially leading to a decline in Black homeownership rates that falls well below the rates seen in previous generations. Consequently, this trend would result in an unprecedented number of Black individuals aged 65 and over becoming renters.
- In 2017, single women could afford to purchase a small home in 26 cities, while renting alone was within their reach in only 2 cities. In contrast, single men could afford to rent a studio or one-bedroom apartment in 18 cities during the same period.
- In 2022, single women owned the majority, or 58%, of the approximately 35.2 million homes owned by unmarried Americans. In contrast, single men owned nearly 42% of these homes.
- In 2022, single men comprised only 9% of home buyers. In comparison, single females accounted for a higher proportion at 19%.
By Educational Attainment
- Younger Millennial homeowners lead in education levels among homeowners, with 80% holding at least an associate’s degree or higher. They are followed closely by older Millennials in terms of educational attainment.
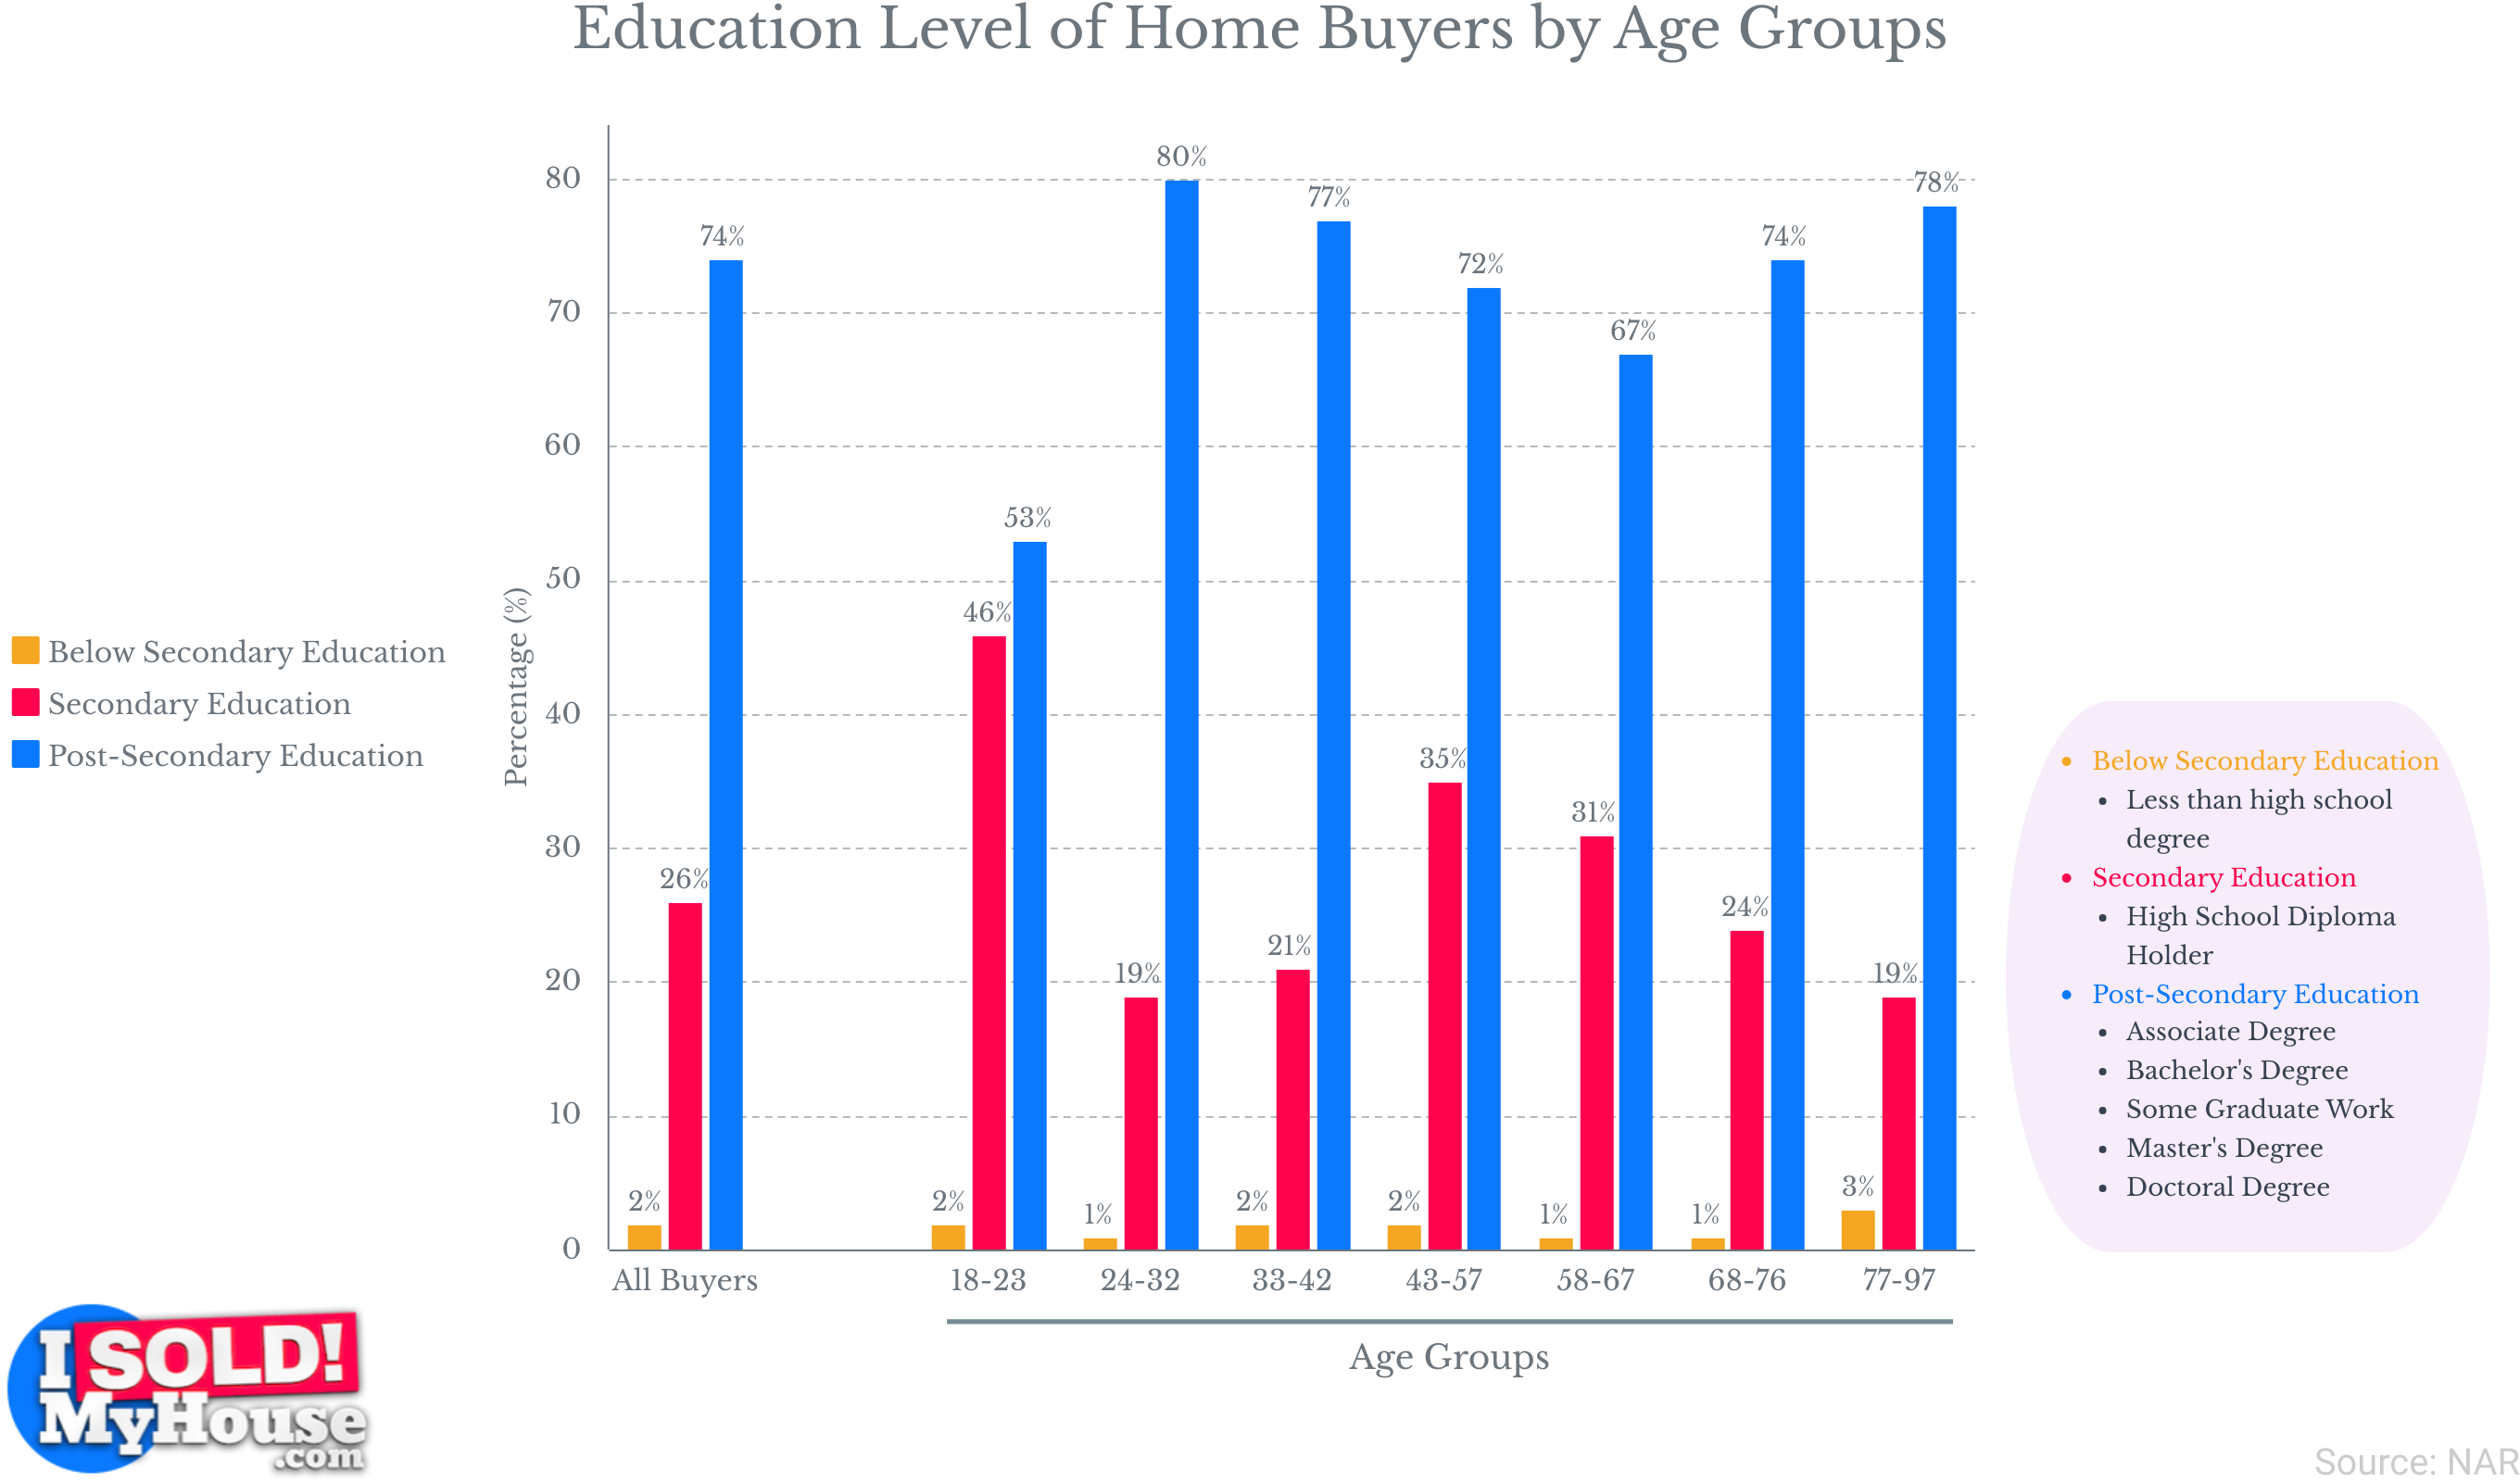
- When comparing homeowners to renters, a larger percentage of homeowners, specifically 41.6%, had attained a bachelor’s degree or higher. In contrast, renters lagged behind with only 28.7% holding such educational qualifications.
- In 2021, approximately 51% of renters had an educational attainment level of less than a high school education, encompassing around 5.8 million renters. Homeowners with a similar level of educational attainment were close behind, comprising 49% or roughly 5.7 million homeowners.
- In 2021, approximately 23.9 million homeowners, constituting 63% of this group, possessed either some college education or an associate’s degree. In contrast, 14 million renters, accounting for 37%, held similar levels of educational attainment.
- In 2021, just 28% of renters held a Bachelor’s degree or higher. In contrast, homeowners with a Bachelor’s degree or higher comprised a significantly larger proportion at 72%.
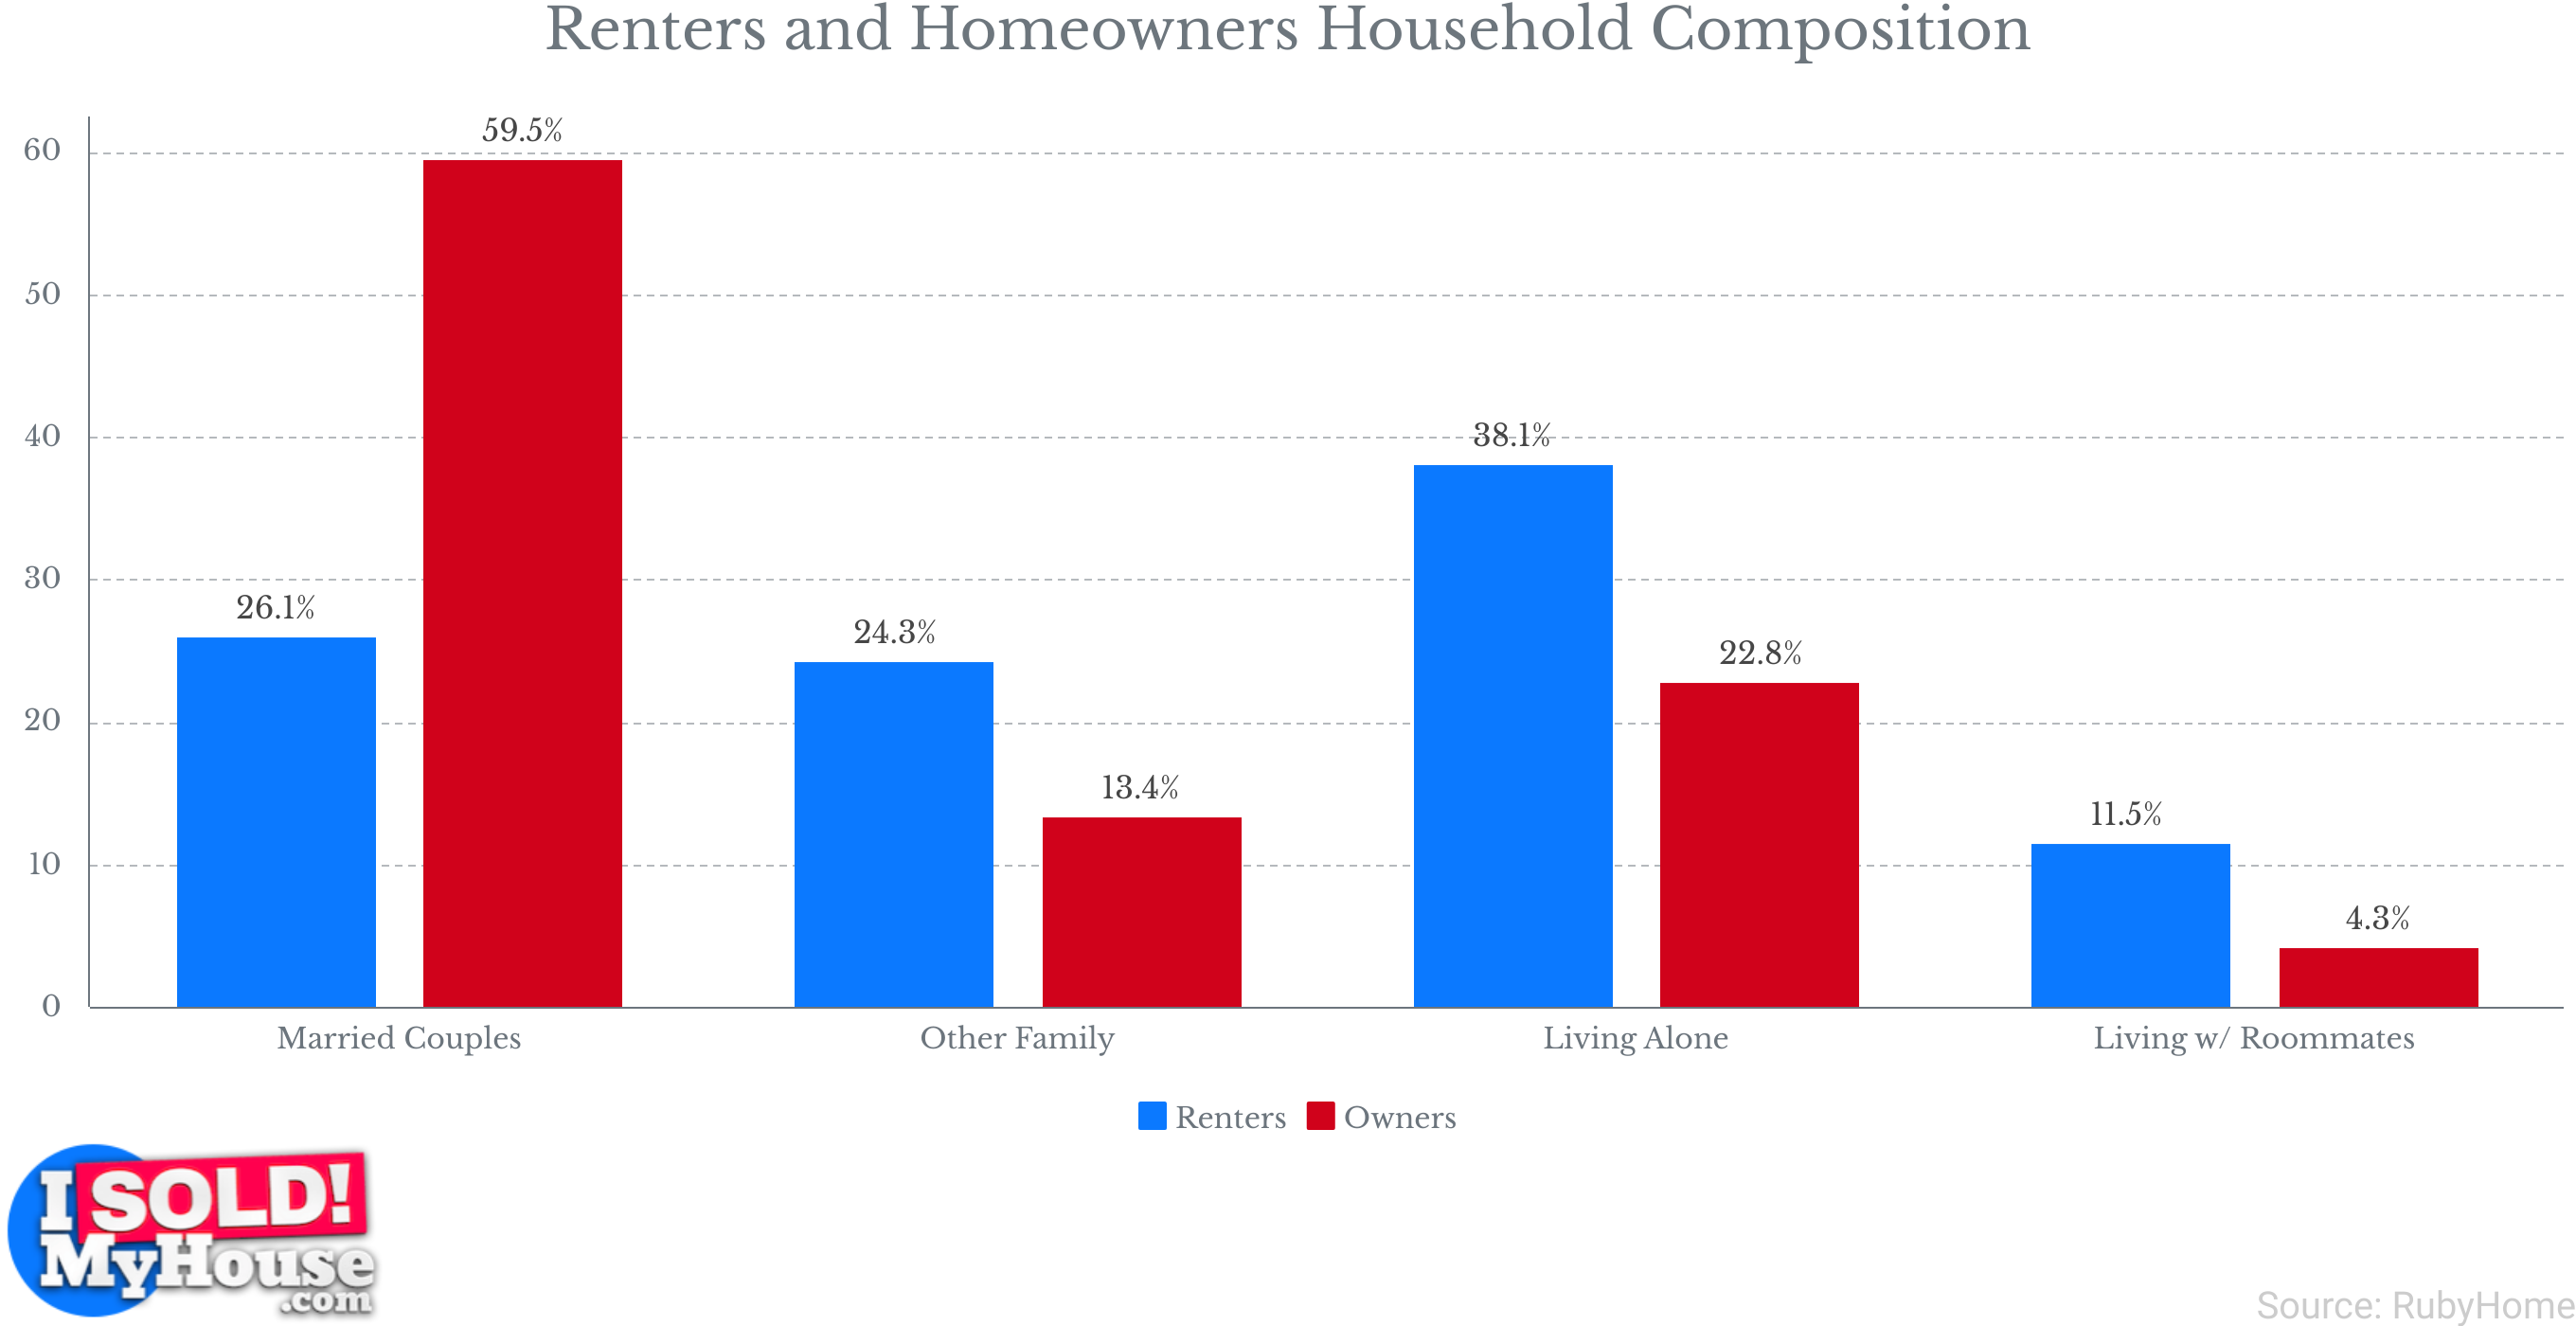
By Household Composition
- Individuals who live alone constitute the largest segment of renters, comprising 38.1% of the total. They are followed by married couples at 26.1%, those residing with other families at 24.3%, and individuals living with roommates at 11.5%.
- In 2022, 59% of all renters were pet owners, with 38% of renter households owning at least one dog and 29% owning at least one cat.
- In 2022, approximately 60% of homebuyers consisted of married couples. Unmarried couples represented 9% of homebuyers during the same year.
- In 2022, older Millennials stood out with the highest proportion of married home buyers, comprising 64% of this demographic group compared to other generations. Conversely, among home buyer couples, younger Millennials held the highest share of unmarried couples at 21%.
- In 2022, among home buyers aged 23 to 96, 31% had children under the age of 18 living at home, while the remaining 69% reported having no children in their households. Specifically, among home buyers aged 32 to 41, approximately 58% had at least one child under the age of 18 residing in their homes.
- In 2021, the total number of non-family households in the United States was nearly evenly divided between homeowners and renters. Specifically, there were 21.6 million owner-occupied non-family households and 21.7 million renter-occupied non-family households.
By Household Wealth
- As a general trend, renters tend to have lower household incomes compared to the average American. Roughly 54% of renters earn less than $50,000, while 29% fall within the income range of $50,000 to less than $100,000.
- In 2021, homeowners boasted a median household income of $78,000. To compare, renters had a considerably lower median household income of $41,000 in the same year.
- In 2021, among all American households, there were 2.36 million renter households with annual incomes of less than $5,000. In comparison, there were 1.49 million homeowner households in the same income bracket.
- In 2021, there were 18.38 million owner-occupied households with annual incomes of $150,000 or more. Conversely, only 3.04 million renter-occupied households fell within the same annual income bracket.
- In 2022, the average credit score for first-time homebuyers stood at 746. Conversely, in 2020, the average credit score for renters was 683.
By State
Dynamic disparities exist between homeowners and renters on a state-by-state basis, underscoring that housing is not a one-size-fits-all proposition. In this section, we endeavor to delve into the distinctive patterns, preferences, and challenges encountered by individuals and families in these specific states.
Examining these state-specific variations allow us to attain a more granular understanding of housing trends and the associated challenges.
- As of January 2023, the state with the highest homeownership rate is West Virginia, standing at 73.7%. Following West Virginia are Maine (72.9%), Minnesota (71.9%), Michigan (71.7%), and Delaware (71.4%) in the list of states with relatively high homeownership rates.
- As of January 2023, the state with the highest renter rate in the United States is the District of Columbia, with a rate of 57.5%. Following the District of Columbia, the states with high renter rates include New York (45.9%), California (44.7%), Nevada (42.9%), and Hawaii (39.7%).
- The state with the lowest renter rate is West Virginia, with a rate of 26.3%. On the other hand, the District of Columbia has the lowest homeownership rate, standing at 42.5%.
- The median home value in West Virginia, which boasts the highest homeownership rate among U.S. states, stands at $158,668. As of September 2023, the average salary in West Virginia is $55,553 annually, which translates to approximately $27 per hour.
- As of September 2023, the typical home value in the District of Columbia, which has the lowest homeownership rate, is $618,437. Additionally, the average salary in the District of Columbia stands at $78,629 annually, equivalent to approximately $38 per hour.
- Hawaii has the highest average monthly rent among U.S. states, standing at $1,651. Following Hawaii are the District of Columbia ($1,607), California ($1,586), Maryland ($1,415), and New Jersey ($1,368).
- West Virginia has the lowest median monthly rent among all states, coming in at $732. Following West Virginia are Arkansas ($760), South Dakota ($761), Kentucky ($783), and Mississippi ($789).
- The state with the highest median home price in 2021 was New York, with a median price of $819,900. It was followed by California at $785,900, Hawaii at $720,200, the District of Columbia at $668,250, and Washington at $618,000.
- The state with the lowest median home price in 2021 was Iowa, with a median price of $230,600. It was followed by Ohio at $240,900, Kentucky at $251,300, Michigan at $252,200, and Oklahoma at $253,200.
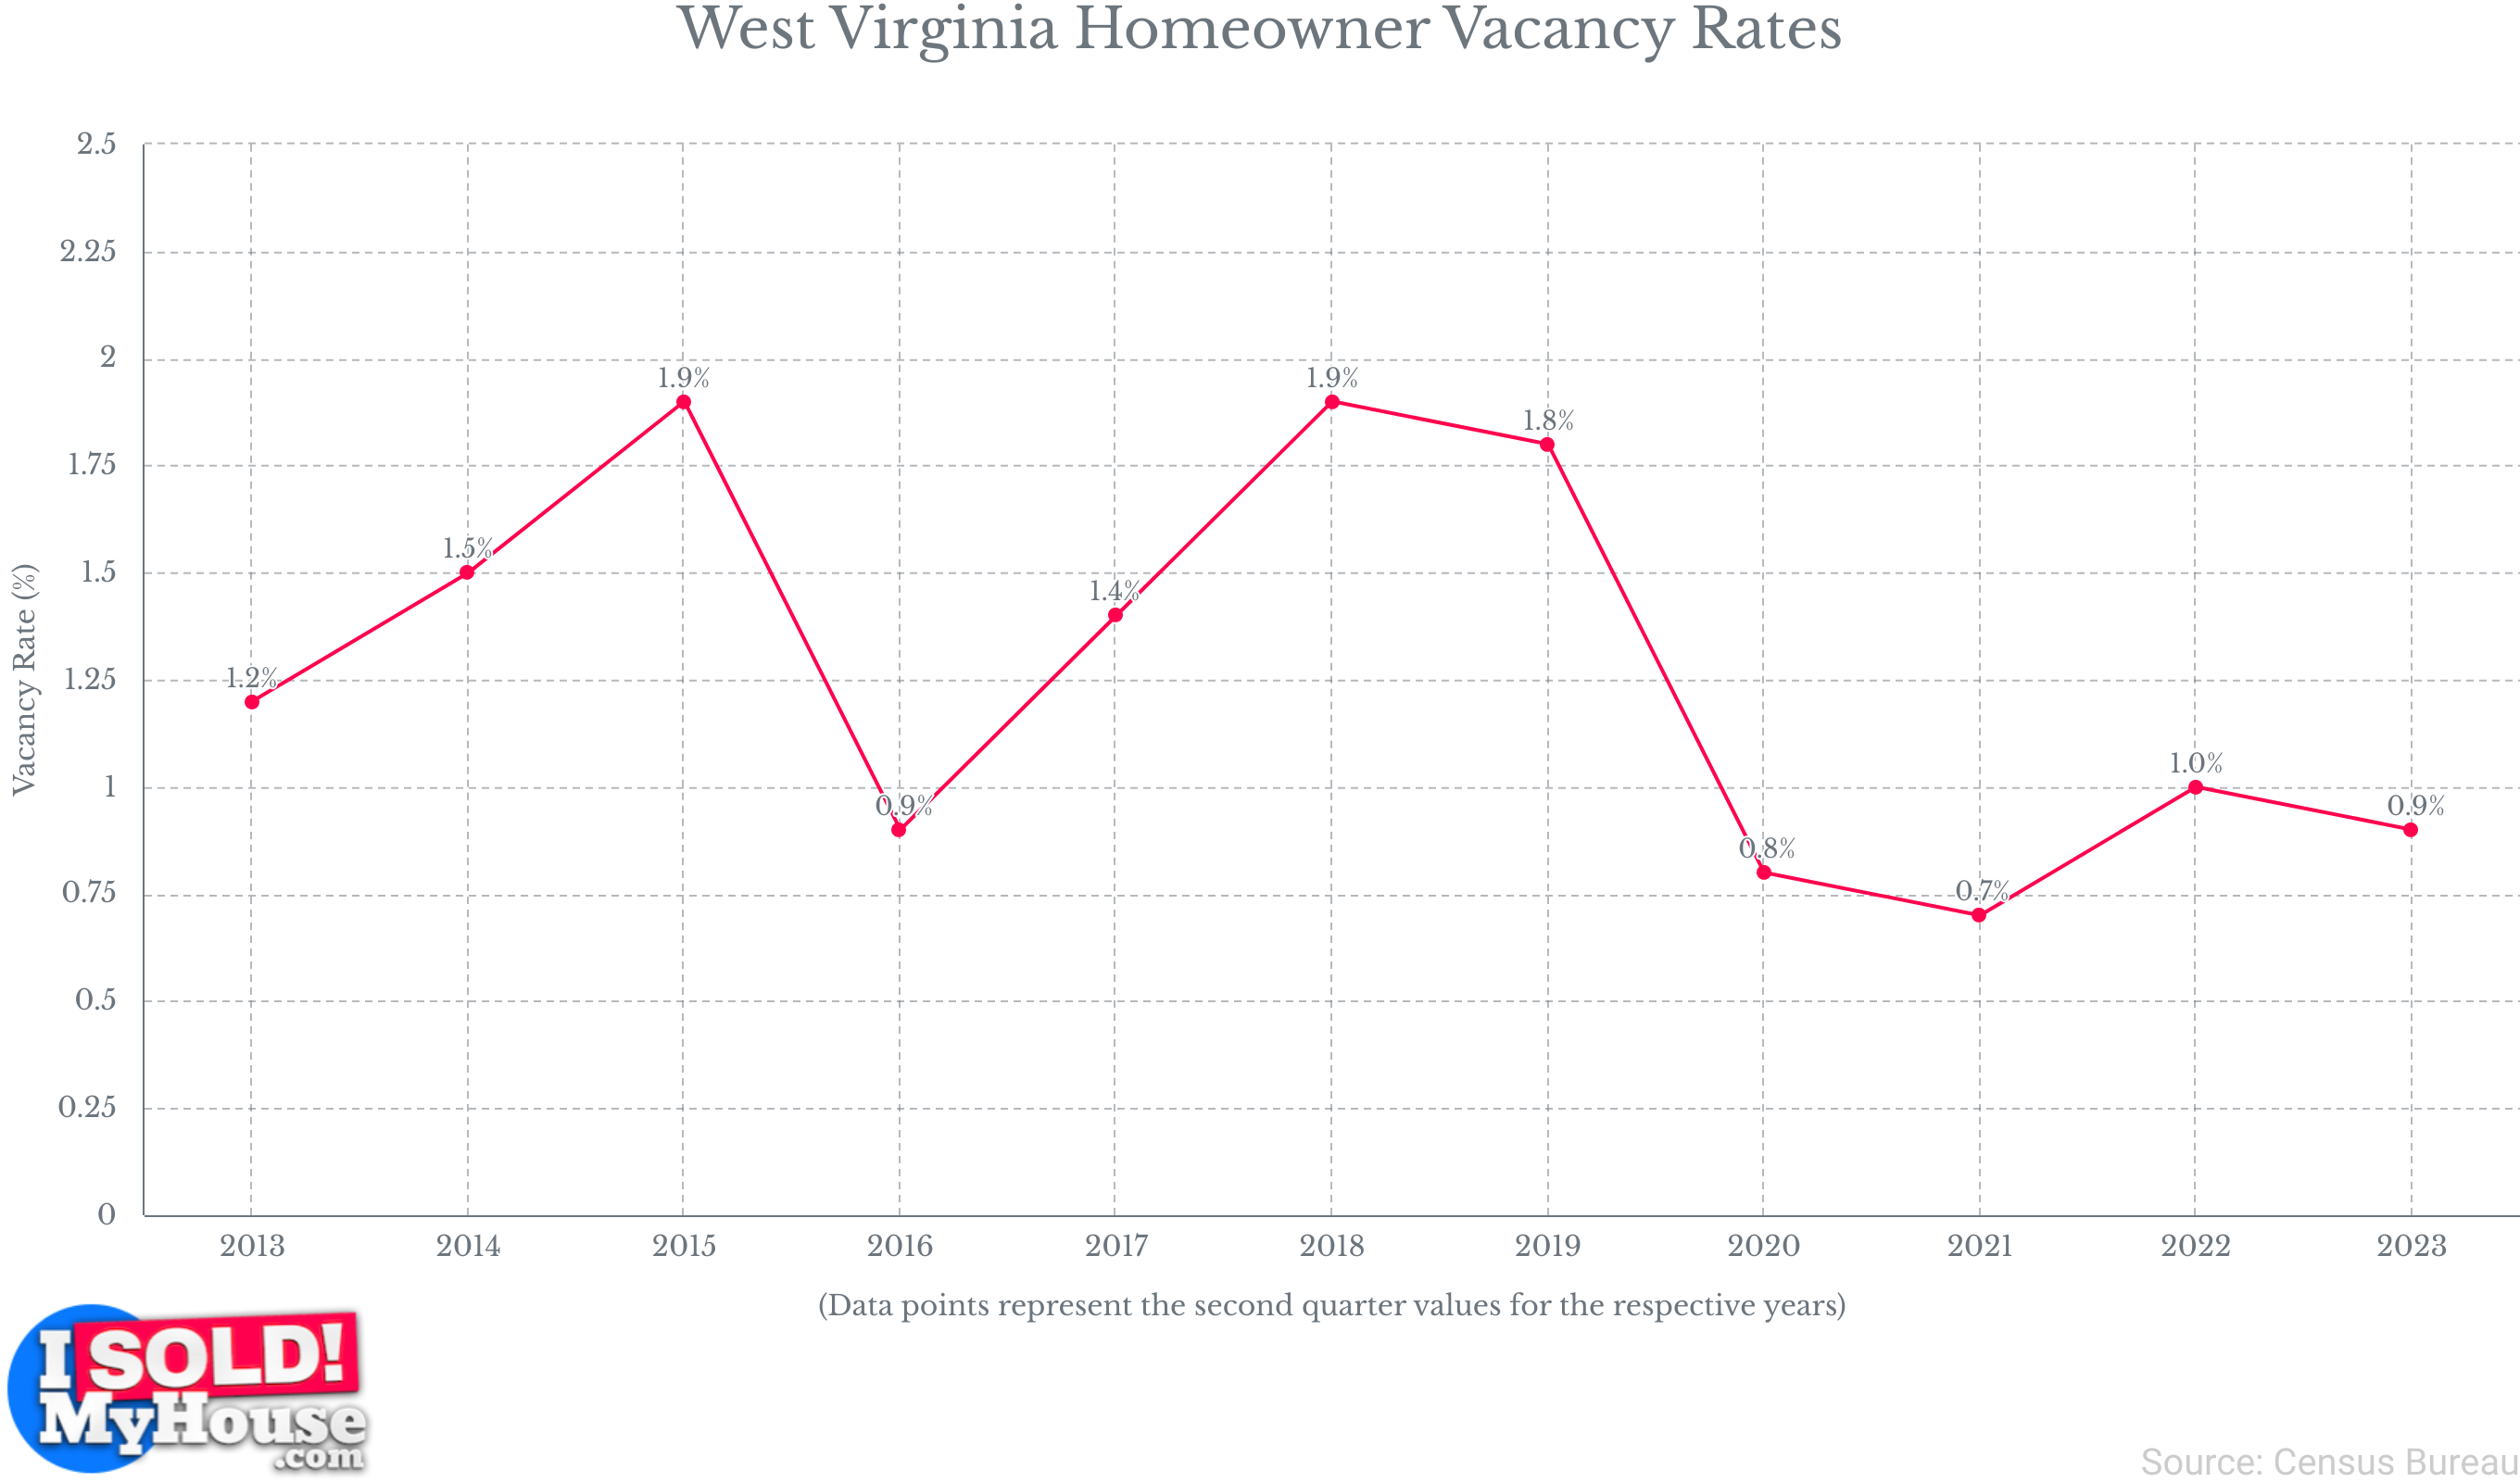
West Virginia Homeowner vs Renter
- In the second quarter of 2023, the homeowner vacancy rate in West Virginia stood at 0.9%. This represented a slight decrease from the rate of 1.0% recorded in the second quarter of 2022.
- As of July 2022, West Virginia had a total of 861,633 housing units. Among these, 73.9% were owner-occupied housing units.
- In 2021, West Virginia had a total of 711,352 households, with an average of 2.47 occupants per household.
- In the second quarter of 2023, the rental vacancy rate in West Virginia stood at 5.4%, representing a notable decrease from the rate of 7.3% recorded in the second quarter of 2022.
- In 2023, the average fair market rent in West Virginia stands at $614 for a studio or efficiency unit and $1,161 for a 4-bedroom home or apartment.
- In 2023, the median rent price in West Virginia stands at $950 per month, which is $1,119 less than the national median rent.
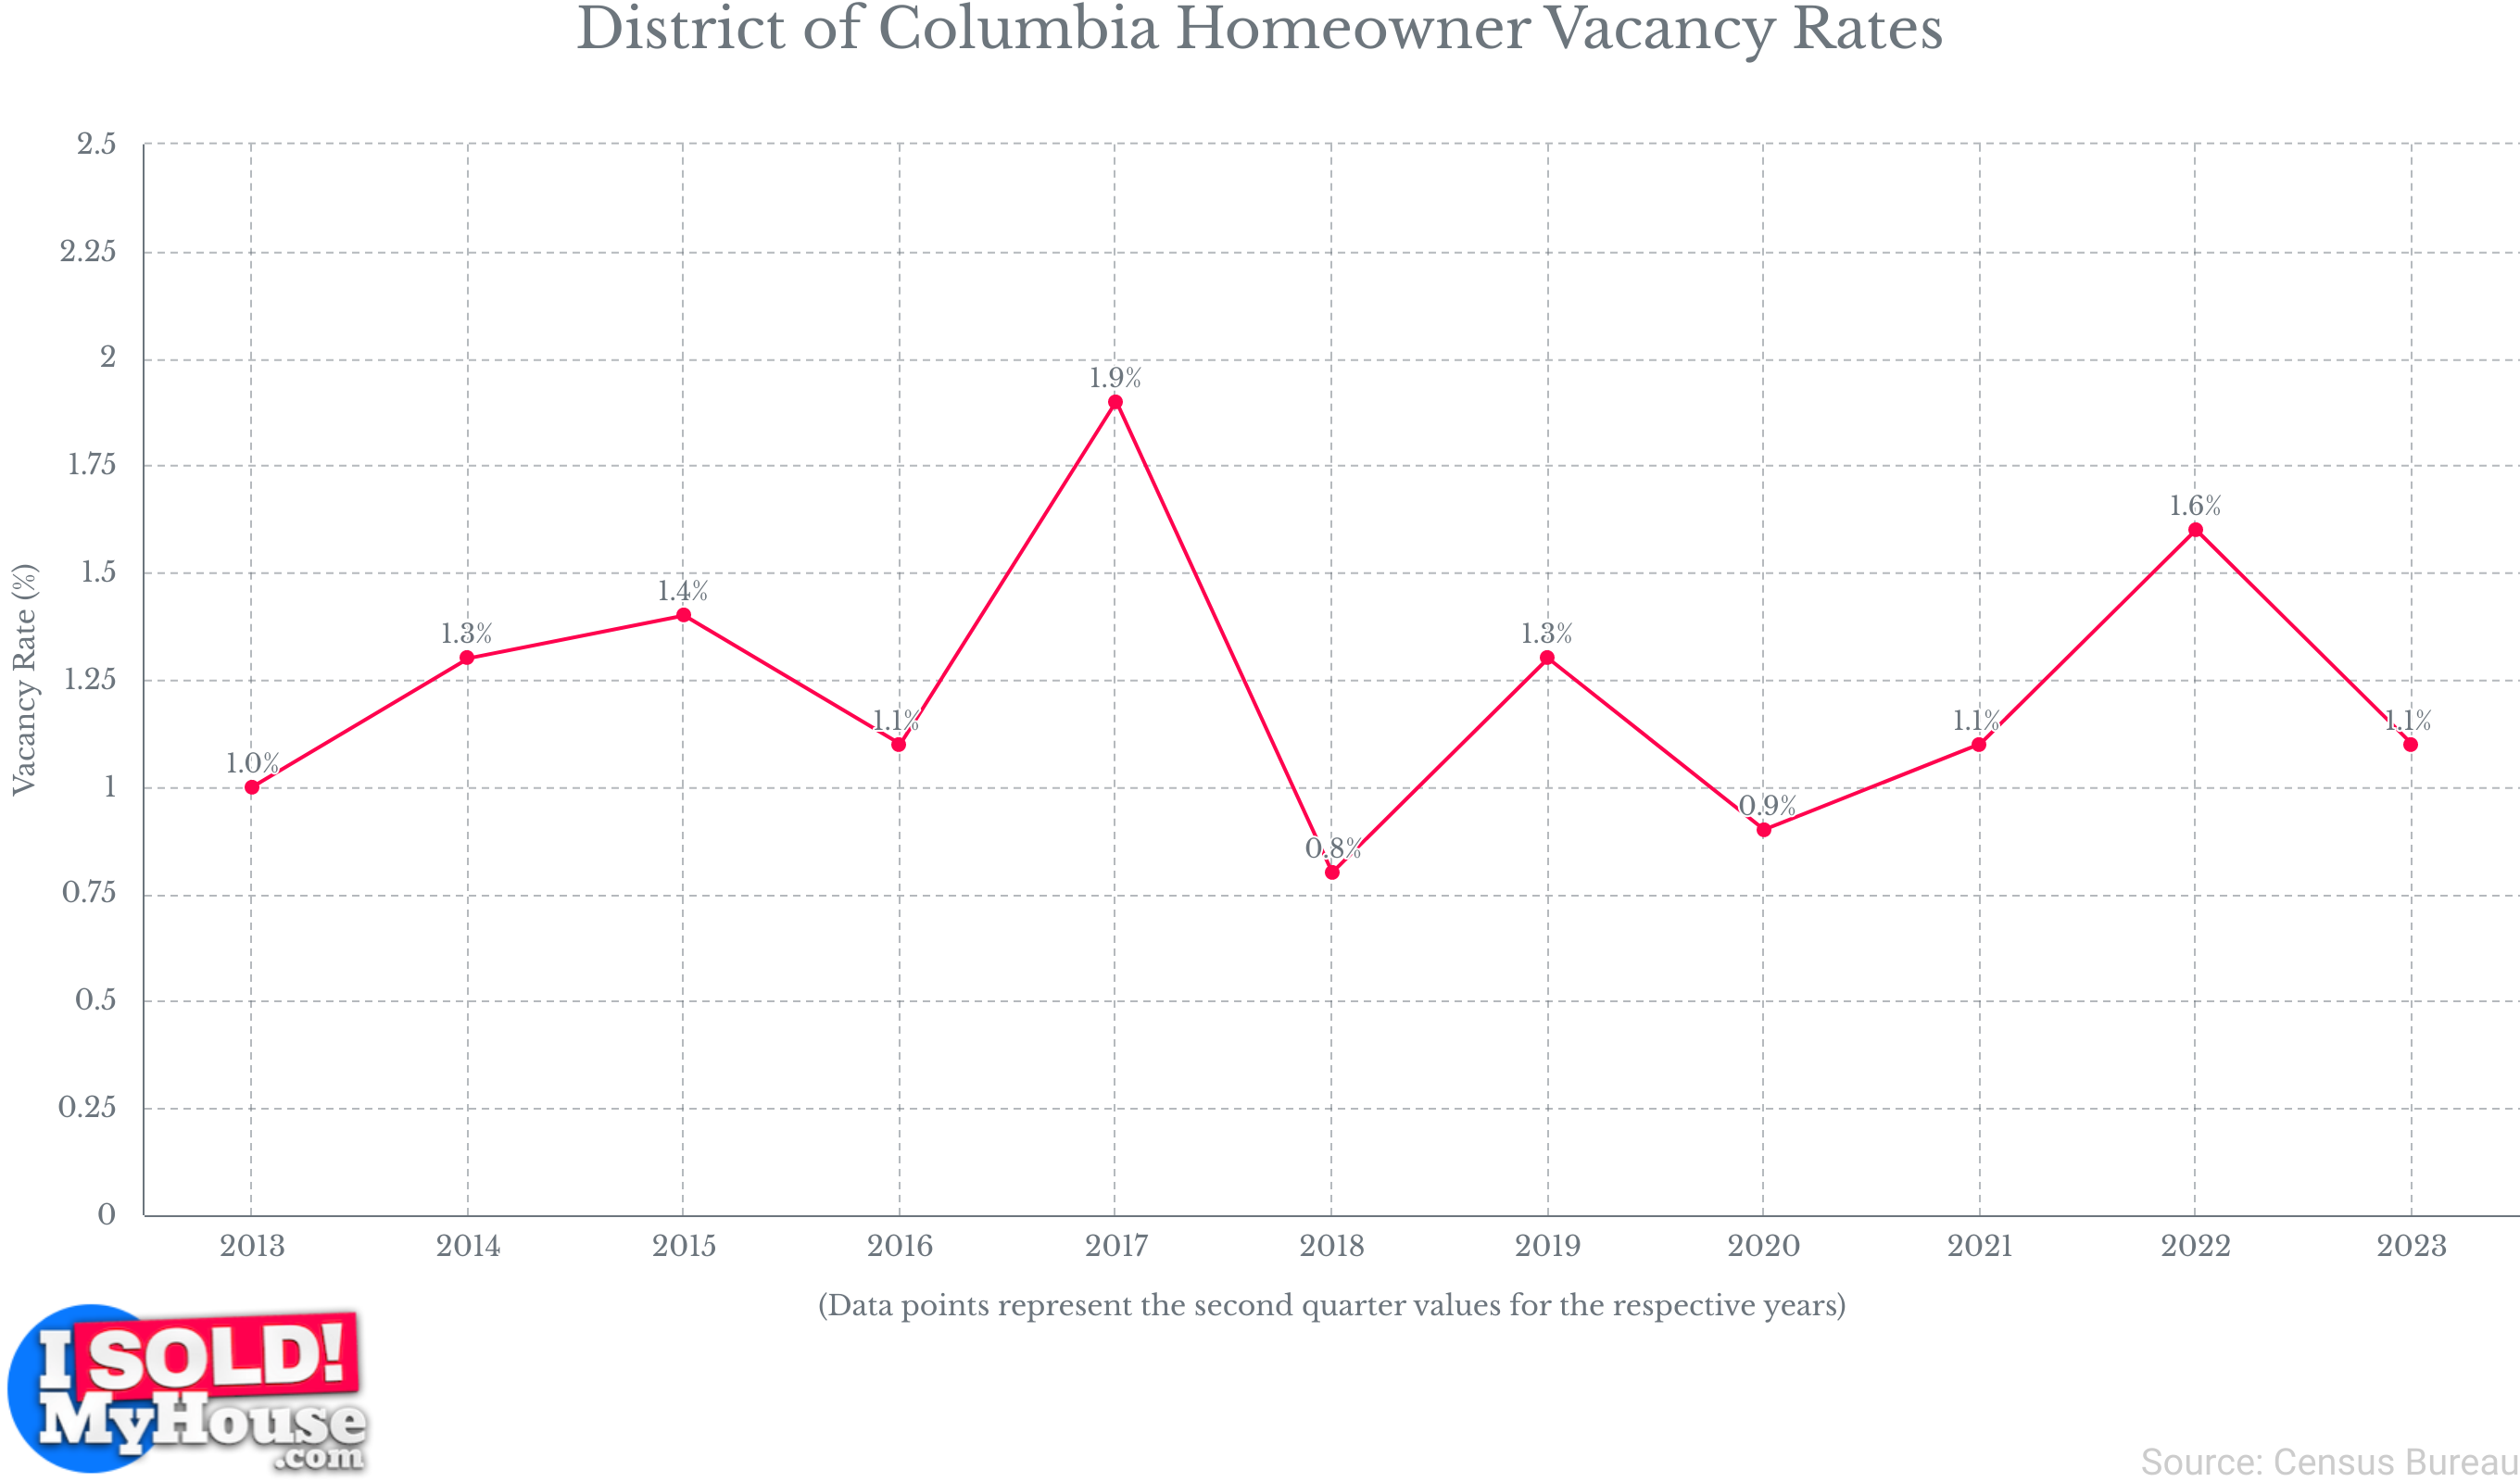
District of Columbia Homeowner vs Renter
- In the second quarter of 2023, the homeowner vacancy rate in the District of Columbia was 1.1%, marking a slight decrease from the rate of 1.6% recorded in the second quarter of 2022.
- As of July 2022, there were a total of 360,890 housing units in the District of Columbia. Among these, 41.5% were owner-occupied in 2021.
- In 2021, there were 310,104 households in the District of Columbia, with an average of 2.08 occupants per household.
- In the second quarter of 2023, the rental vacancy rate in the District of Columbia stood at 8.5%. This rate remained stable and unchanged from the rate recorded in the second quarter of 2022, which was also 8.5%.
- In 2023, the average fair market rent in the District of Columbia is $1,589 for a studio or efficiency and $2,742 for a 4-bedroom home or apartment.
- In 2023, the median rent price in the District of Columbia is $2,650 per month. This rent price is $581 higher than the national median.
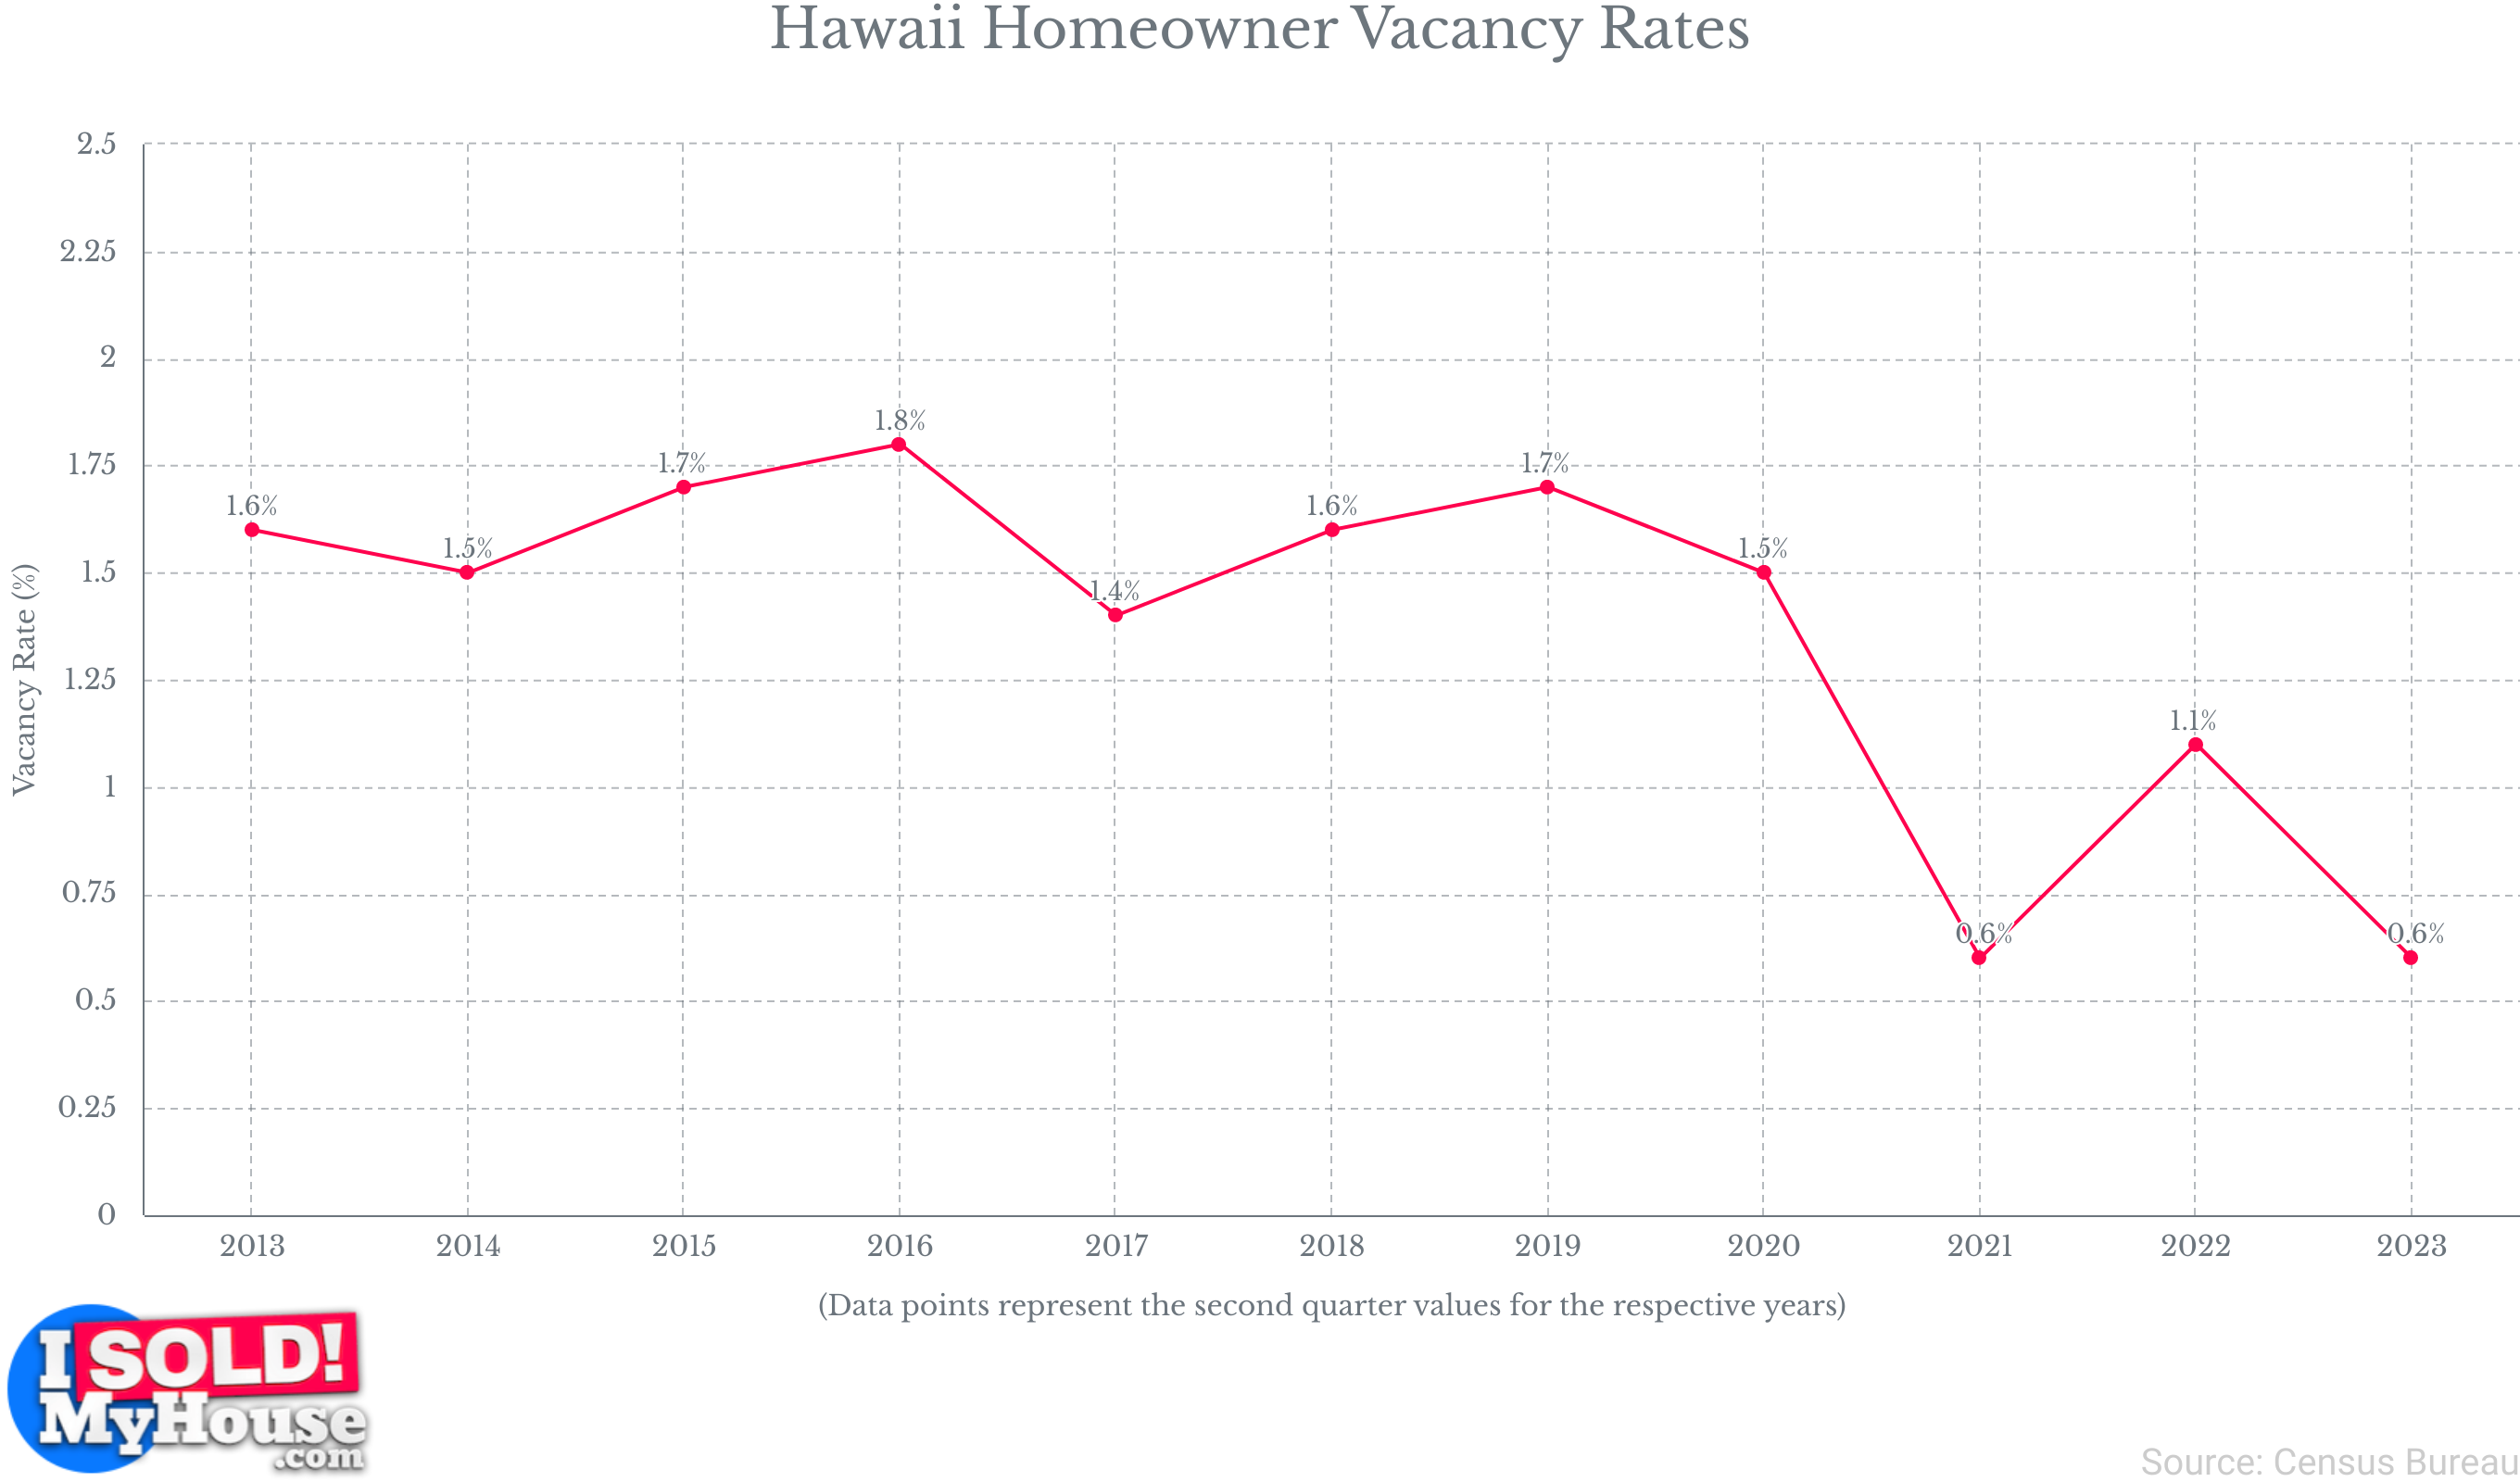
Hawaii Homeowner vs Renter
- In the second quarter of 2023, Hawaii’s homeowner vacancy rate stands at 0.6%. This rate marked a notable decline from the rate of 1.1% recorded in the same period of 2022.
- As of July 2022, there were 568,075 housing units in Hawaii. In 2021, 61% of these housing units were owner-occupied.
- In 2021, there were 478,413 households in Hawaii, with an average of 2.95 occupants per household.
- In the second quarter of 2023, Hawaii’s rental vacancy rate surged to 9.3%, marking a substantial increase from the 5.4% rate observed in the same quarter of 2022.
- As of 2023, the average fair market rent in Hawaii stands at $1,116 for a studio or efficiency, while a 4-bedroom home or apartment commands an average rent of $2,250.
- In 2023, the median rent in Hawaii is $2,850 per month, which is $781 higher than the national median.
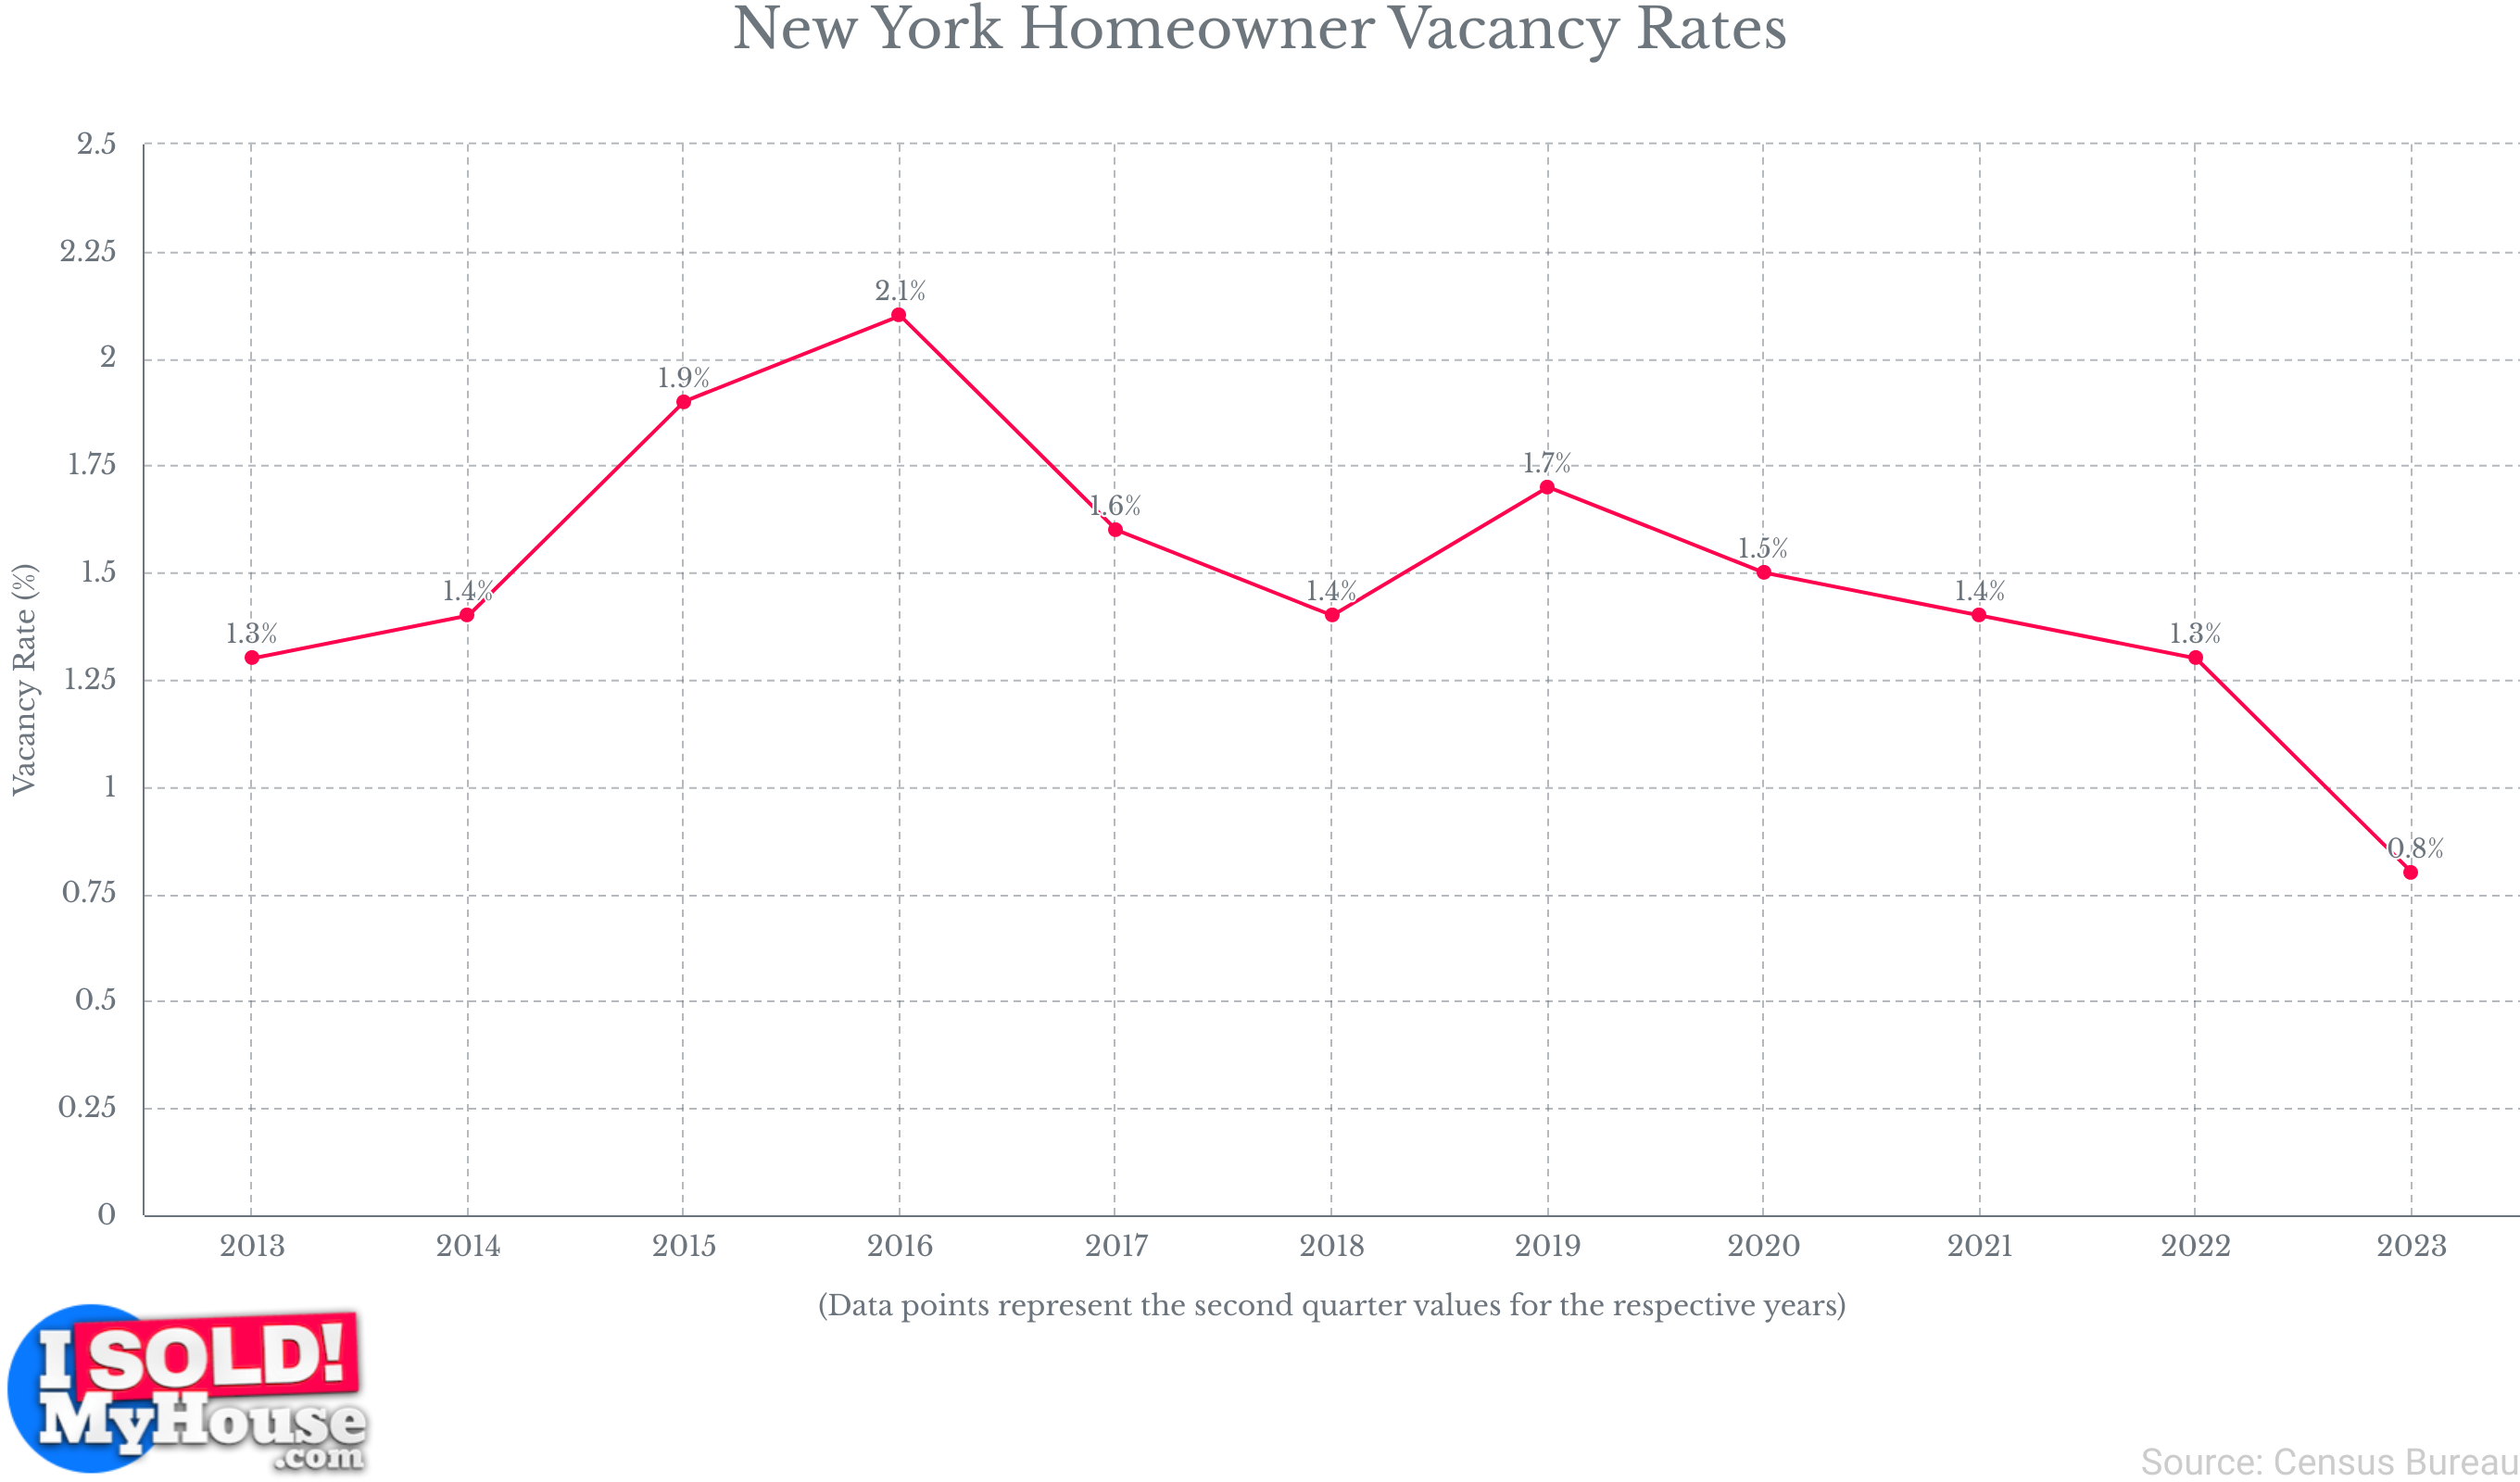
New York Homeowner vs Renter
- As of the second quarter of 2023, the homeowner vacancy rate in New York stands at a mere 0.8%, marking a notable decrease from the 1.3% rate observed in the same quarter of the previous year (Q2 2022).
- As of July 2022, New York had 8.5 million housing units, with 54.4% of them being owner-occupied in 2021.
- In 2021, New York had 7.5 million households, each with an average of 2.60 occupants.
- In the second quarter of 2023, the rental vacancy rate in New York stood at 4.8%, marking a slight increase from the 4.4% rate recorded in the same period in 2022.
- In 2023, the average fair market rent in New York is $968 for a studio or efficiency and $1,764 for a 4-bedroom home or apartment.
- In 2023, the median rent price in New York is $3,647 per month, which exceeds the national median by $1,578.
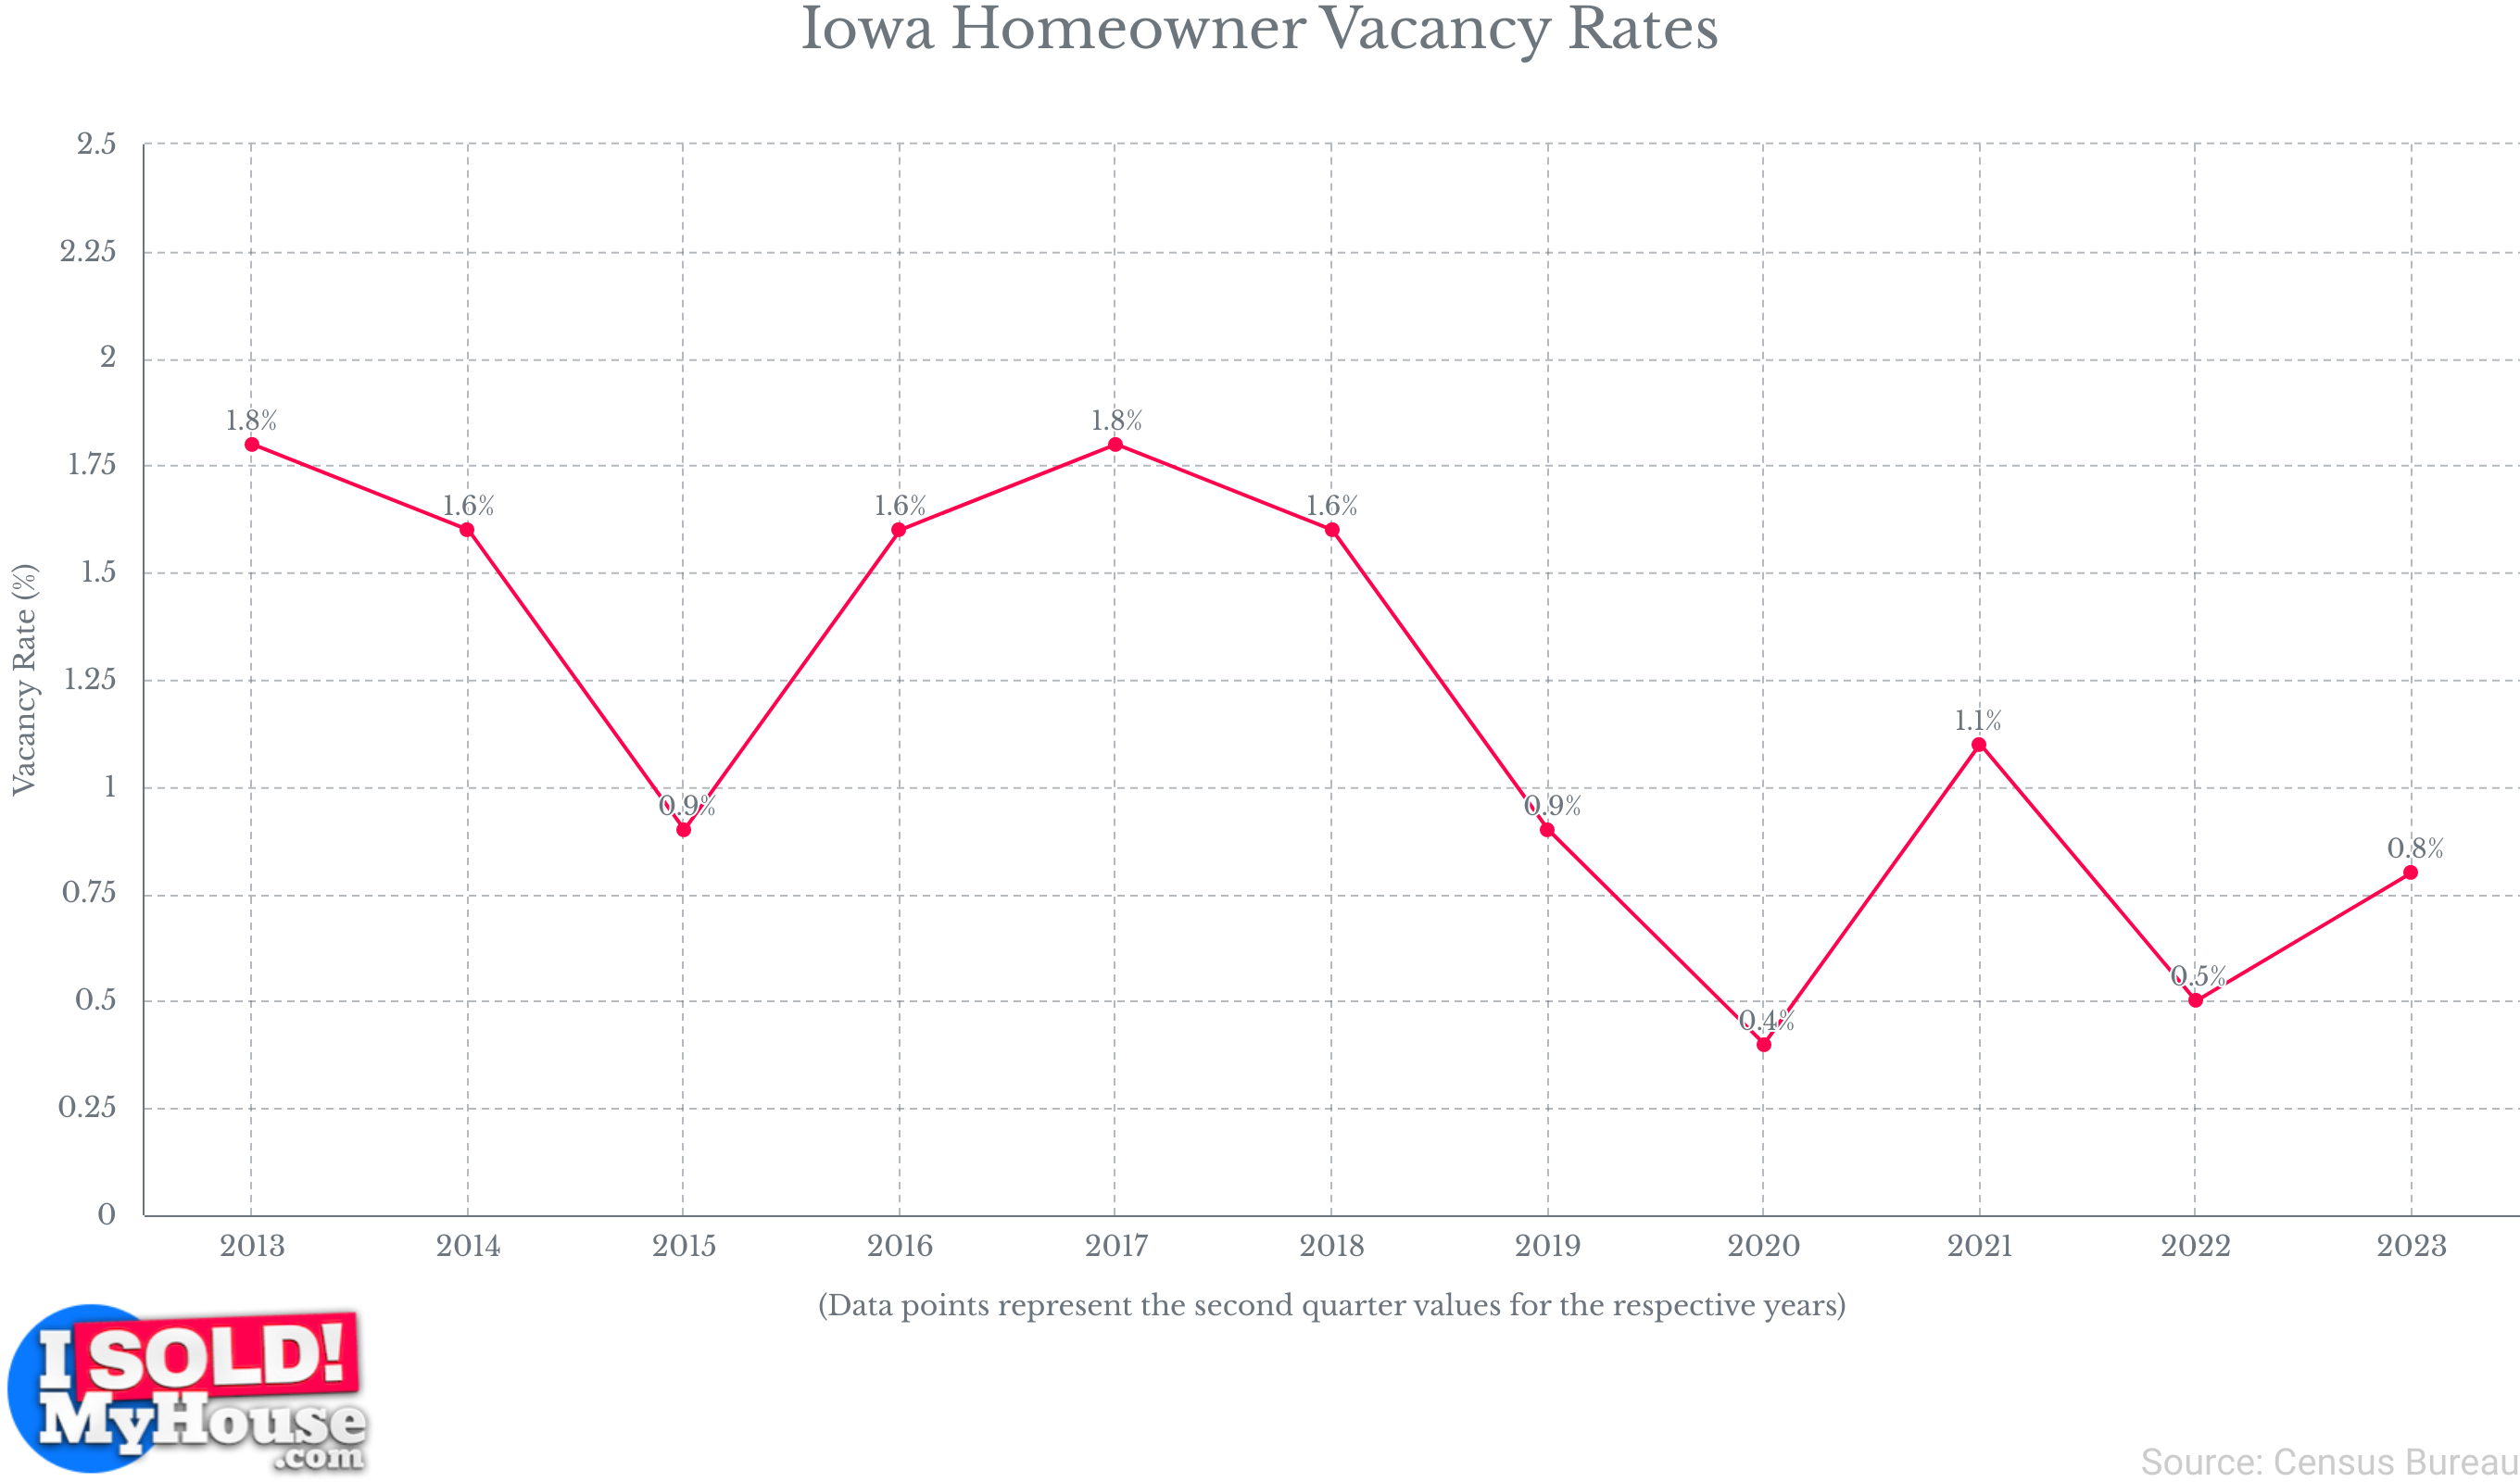
Iowa Homeowner vs Renter
- In the second quarter of 2023, Iowa’s homeowner vacancy rate stands at 0.8%, representing a slight increase from the rate of 0.5% recorded in the same period in 2022.
- As of July 2022, Iowa had 1.4 million housing units, of which 71.6% were owner-occupied in 2021.
- In 2021, Iowa had 1.2 million households, each with an average of 2.42 occupants.
- In the second quarter of 2023, Iowa’s rental vacancy rate stood at 6.9%, marking a slight uptick from the 6.5% rate observed in the same quarter of 2022.
- In 2023, the average fair market rent in Iowa stands at $581 for a studio or efficiency and $1,075 for a four-bedroom home or apartment.
- In 2023, the median rent price in Iowa stands at $1,100 per month, which is $969 less than the national median.
FAQ
What are the advantages of renting over owning a home?
The primary advantage of renting is the reduced financial commitment compared to buying a home. Renters are not required to cover the significant upfront costs associated with homeownership, such as a down payment and closing expenses. This financial flexibility enables renters to allocate their resources based on their current needs and preferences, without being burdened by the additional costs that come with owning a home.
Furthermore, renters benefit from the peace of mind that comes with not being responsible for property maintenance and repairs. Landlords assume these responsibilities, sparing renters from unexpected and potentially expensive home-related costs.
What are the advantages of owning a home compared to renting?
Owning a home means actively building equity in your property, essentially investing in yourself rather than contributing to a landlord’s income. Over time, this equity can grow significantly, potentially becoming a powerful asset for your financial future.
Moreover, as long as you maintain it and make strategic improvements, the value of your home can appreciate, laying the foundation for generational wealth that you can pass down to future family members.
Furthermore, homeowners enjoy the freedom to shape their living space’s look and ambiance according to their preferences. In contrast, renters are typically limited in making substantial changes to their rental properties without landlord approval.
When you own your home, you have the autonomy to make these alterations without needing permission. What’s more, the improvements you make may boost the overall value of your home, allowing you to profit from them when you decide to sell.
Is renting or owning a home better?
Determining whether owning a home or renting is the better choice remains a complex question, as it depends on the intricacies of an individual’s lifestyle, financial circumstances, and personal aspirations. It’s also vital to recognize the multifaceted nature of housing markets and the ever-changing tapestry of life situations.
Broad statements like “owning a home is superior” or “renting is the ultimate choice” oversimplify a subject that is inherently diverse and nuanced. To make an informed decision about housing, one must consider a multitude of factors, each uniquely shaped by their specific context.
What are the advantages of living in a house compared to an apartment, and vice versa?
Living in a house provides more space than living in an apartment, offering greater privacy and more room to move around. Moreover, many houses on the market come with spacious backyards and front yards. If having a personal outdoor space is something you value, living in a house may be the best choice for you.
On the other hand, living in an apartment offers a more low-maintenance option. Because the space is smaller, there are fewer components to worry about compared to a house. This makes property maintenance easier and more convenient.
Additionally, apartments often come with various amenities such as recreational areas and communal spaces like playgrounds, swimming pools, and fitness centers, enhancing your overall living experience.
What factors influence the cost of renting?
The most pivotal factor influencing rental rates is location, serving as the cornerstone for determining rental prices. For instance, properties situated in metropolitan areas and exclusive suburbs typically command higher rents compared to rural regions.
This is a straightforward manifestation of supply and demand dynamics. Properties in urban and suburban areas are deemed more desirable due to their proximity to city centers or business districts, the quality of local schools, access to amenities, and neighborhood safety. Furthermore, the overall size of the property, including the number of bedrooms and bathrooms, plays a significant role.
What causes housing prices to rise and fall?
Like prices in any other industry, housing prices are primarily determined by the economic principles of supply and demand. Housing prices typically decrease when there are more sellers than buyers, whereas when there are more buyers than sellers, housing prices rise.
A robust economy characterized by low unemployment rates also tends to drive housing prices upward. A strong economy fosters confidence in job security and the ability to take on mortgage debt. This confidence leads to increased loan applications, greater willingness from banks to lend, and a higher likelihood of loan approval for potential buyers.
Conversely, fewer individuals can afford to purchase houses in a struggling economy, resulting in reduced competition in the housing market. Reduced competition, in turn, leads to lower housing prices as an incentive for potential buyers to make a purchase.
Which demographic group rents the most?
Approximately two-thirds of Americans aged 35 and under are more inclined to rent than other age brackets. Moreover, individuals within the lowest income quartile choose to rent their homes, as do those whose net worth falls below the 25th percentile.
What demographic group holds the largest number of properties in the United States?
In the United States, when it comes to property ownership, white households lead the demographic chart with the highest rate of homeownership. Following closely behind are Asian households and Hispanic households. In contrast, black households have the lowest homeownership rate among these demographics. Furthermore, after married couples, single women constitute the second-largest group of homeowners.
Sources
- zillow.com
- rentdata.org
- census.gov
- redfin.com
- ziprecruiter.com
- fanniemae.com
- rentcafe.com
- nar.realtor
- rubyhome.com
- pewresearch.org
- urban.org
- jchs.harvard.edu
- statista.com
- nmhc.org
- foremost.com
- rent.com
- nationalequityatlas.org
- bls.gov
- moodys.com
- cbre.com
- arbor.com
- attomdata.com
- mordorintelligence.com
- creditkarma.com
- jpmorganchase.com
- irs.gov
- ibisworld.com
- fhfa.gov
- truehold.com
- ffiec.cfpb.gov
- realtor.com


